Engineering-Led Experiments
While experimentation is often associated with marketing and revenue, experimentation is also a valuable process for engineers. There are several experiments engineers can conduct to mitigate risk and optimize their software. In DevCycle, experiments are conducted by creating two or more variations of a feature and comparing their performance using Metrics. Developers can use Metrics to assess the health of their features and improve technical performance. This guide discusses how to conduct engineering-led experiments with Metrics.
Prerequisites
To complete this guide, you may want to review the following topics:
- Creating and Managing Variations
- Random Distribution Targeting
- Feature Experimentation
- Creating a Metric and Metric Types
Metrics in DevCycle
Metrics are how DevCycle measures data based on the custom events you choose to track. For example, you may conduct an experiment to determine what features cause the most errors. In this case, you would create a metric to track error rates.
When you create a metric, it is not tied to a specific feature; they can be defined once and applied to as many features as desired. For instance, we could use the same error metric to determine the error rate of other features.
To learn how to create a metric, read Creating and Managing Metrics.
Metrics are available to all customers on any plan. However, Metrics rely on custom events that incur extra costs. These costs will be added to your existing plan. To learn more, read about our pricing, or contact us at [email protected].
Calculating Metrics by Tracking Events
To calculate Metrics, DevCycle uses custom events sent via the API or SDKs. The event data automatically includes which user sent it and which Feature and Variation they were in at that time. To track custom events, we can use the track function in the DevCycle SDKs. For instance, if we want to track errors in a JavaScript program, we would add the following code within the onerror event handler:
const event = {
	type: 'error_event', // this is required
	metaData: {
		'Message': error_message
		'Line': line_number
	}
}
devcycleClient.track(event)
As shown in the code above, we created the event object and passed it into the track function. This sends the event information to DevCycle to calculate the metric.
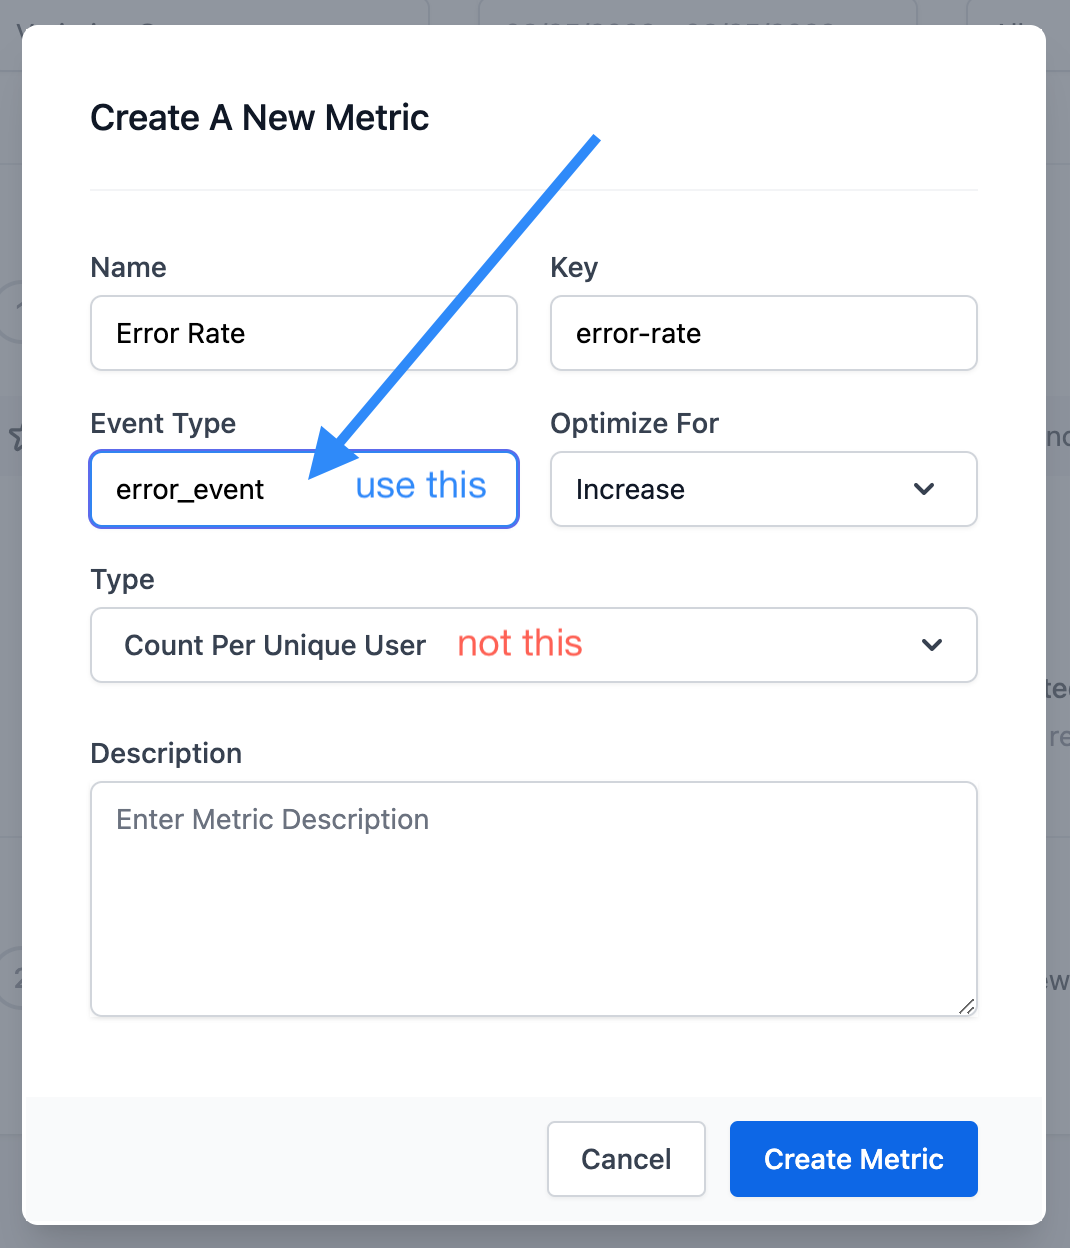
The type field in the object must correspond to the Event Type you defined when you created a metric. This is not to be confused with the Type selected from the dropdown.
If your Metric was a numerical Type (such as Sum Per User, Total Average, etc.) you may want to provide a value within your event. Some numerical data you may want to track are latency, load time, number of API calls, etc. Adding a numerical value to your object in JavaScript would look something like this:
const event = {
  type: 'page_load_time',
  value: 4000,
}
devcycleClient.track(event)
You can include other data within the event object such as date, target, and metadata. For more information about tracking custom events with our other SDKs, refer to Tracking Custom Events.
Once you have set up the SDK to send custom events, you can apply your Metric to a feature.
Suggested Metrics
Metrics are a valuable tool for measuring the technical performance of your system. The following list provides some common metrics engineers may choose to track:
- error rate
- request latency
- time to first paint frontend / page load times
- server load / number of API calls
- API response time
- code path processing times
- time on page
- internal build time
Conducting Experiments
On their own, Metrics are already a valuable tool for monitoring app health. Experimentation takes Metric data a step further. Using Metrics for experimentation enables you to be proactive about risk mitigation and technical optimization before fully releasing features.
Create a Roadmap
Creating a roadmap will aid in the management of your experiments. Make sure you record the experiment’s purpose, hypothesis, features and variations involved, metrics, and the length of the experiment.
Generating a Hypothesis
A well-planned experiment is an effective experiment. Before building your experiment, define what you would like to achieve. Formulate a brief yet specific explanation of what you’re trying to prove and why. Provide context by referring to prior bugs, user feedback, or anything else that prompted you to conduct the experiment.
For instance, you can use an experiment to answer questions like the following examples:
- Will sorting search results significantly increase page load time?
- How significantly does browser caching impact error rates? It is more significant than the improvement in API performance?
Once you’ve determined what you would like to achieve, you can formulate a hypothesis. Your hypothesis should answer the following questions:
- What change will be made?
- Where will that change occur?
- What is the expected outcome?
Answering these questions will result in hypotheses such as the following examples:
- If we rewrite our sorting method with a new algorithm, we expect a decrease in our load time by X%.
- If we store user information in the cache, our error rates will remain below X%.
Be sure that your hypothesis is precise and measurable for effective interpretation of your experiment.
Setting Up Variations
Some of the simplest and most precise experiments are basic A/B tests comparing two variations, one control variant and one treatment variation. For example, to answer the second example hypothesis above, we would have one variation with the use-caching variable off, and another variation with use-caching on. We would then randomly distribute the two variations in a 50/50 split between the variations.
For more complex features you may compare more variations with several combinations of variable values. You would then randomly distribute the variations according to the number of variations you are including in the experiment.
For more information about comparing multiple variations in an experiment, refer to Feature Experimentation.
Choosing Metrics
After creating the necessary variations, select the appropriate metrics for your experiment. It is best to choose metrics that directly result from the changes you are making so your data is not influenced by other factors.
For example, if we expect sorting search results to significantly affect page load time, we would create a Metric to track page load time and attach it to our feature.
Length of the Experiment
The required length of your experiment varies depending on the overall traffic, the observed conversion rate, and the size of the difference in conversion or values between variations. A typical experiment generally requires a minimum of 1-2 weeks to achieve valid statistical significance with a valid cross-section of your user base.
Determine the Winner
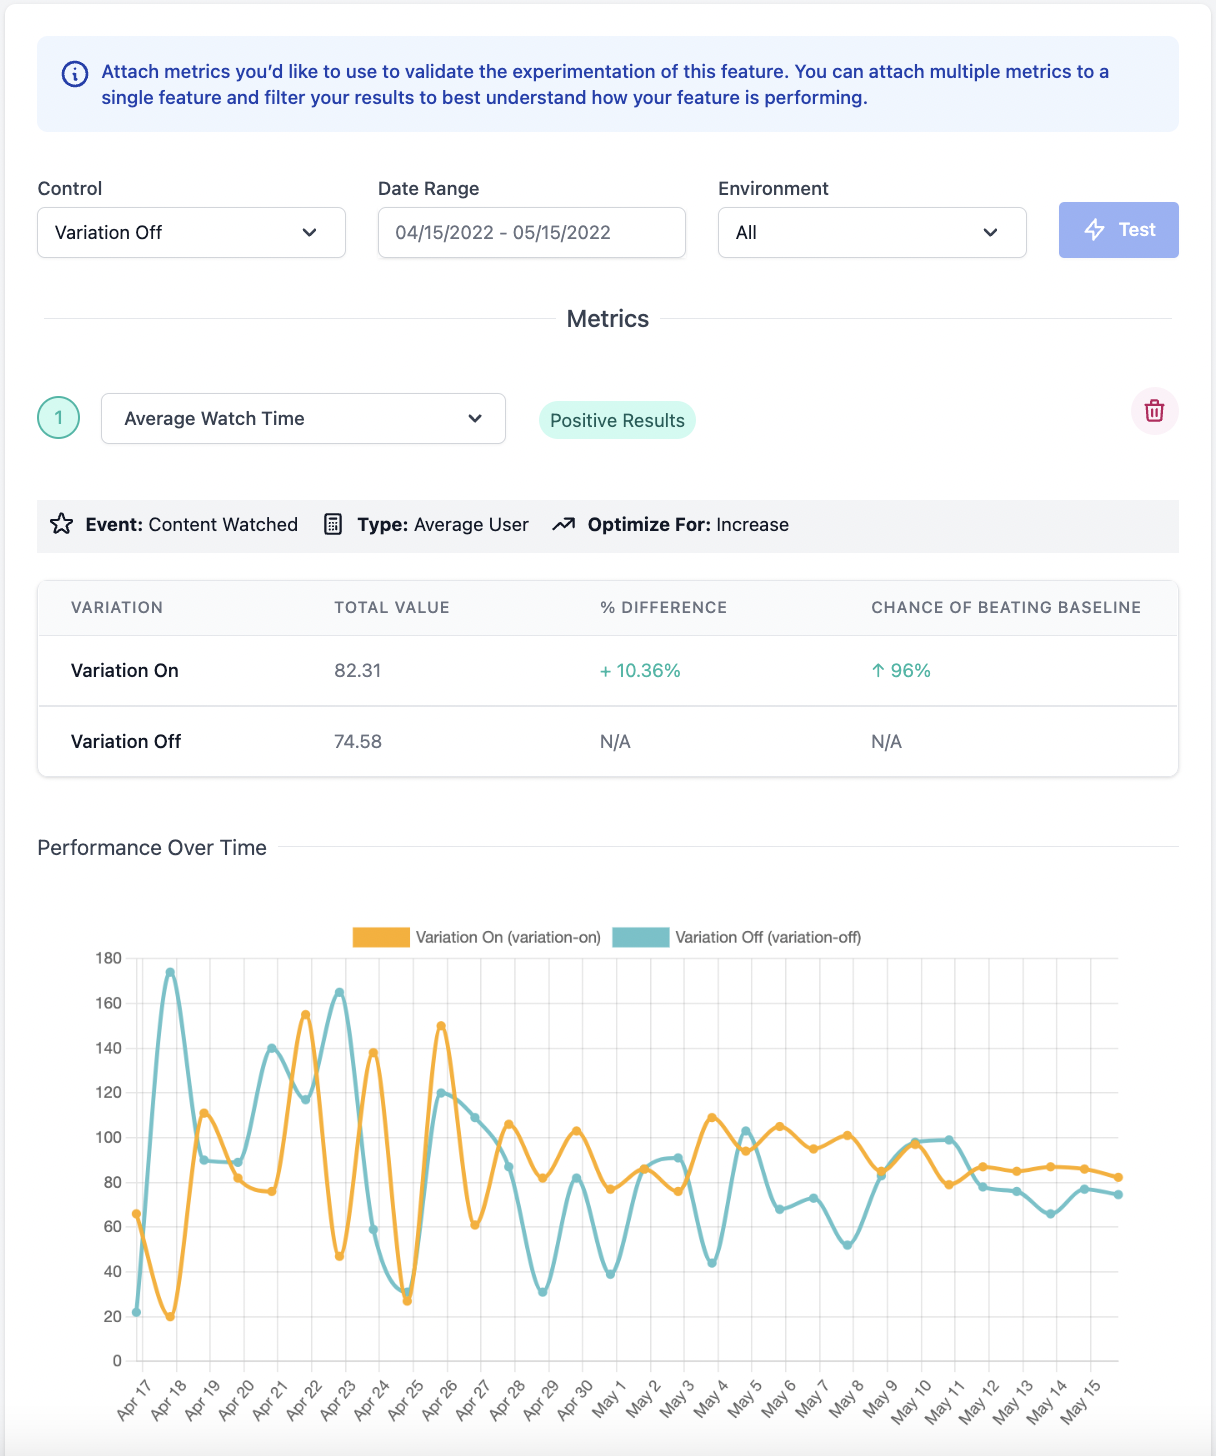
Once the planned time has passed, you can review the graphs created by the Metrics and determine which Variation performed best. When you created Metrics, you define whether a decrease or an increase in values means improvement. Metrics uses this input to clearly show whether the results were positive or negative.
Summary
In this guide, we covered:
- how to implement Metrics to your code
- suggested Metrics for technical performance
- how to conduct experiments