Feature Experimentation
Overview
At DevCycle we believe that Experimentation should be a part of the natural lifecycle of all Features. So no matter the Feature type selected, can be experimented on. Experiments can be as simple as comparing any target audiences against a Metric, or can be fully randomized A/B tests using statistical methodologies.
This article outlines why and how to run and analyze Experiments on your Features within DevCycle.
Why Experiment
Experimentation is crucial for testing modifications to your product. You may investigate which changes would result in the best outcomes. It's also known as split testing or A/B testing, or comparative analysis depending on who you ask.
Experimentation can be used to test new Features, design changes, marketing campaigns, or anything that could potentially impact how a product or service is used. You may want to experiment on any of these things and more:
- Validate to make sure application performance remains the same or improves.
- Validate in a controlled way whether code changes increase or decrease error rates.
- Confirm that a new Feature is driving more conversions or revenue.
- Measure real impacts of Features on SLAs and SLOs.
You've likely been doing "Experimentation" without knowing it. Whenever you release a new feature or service, compare the before and after (and during). When combined with Features, DevCycle can give direct Metrics on a feature's performance during a release, allowing you to react and make changes accordingly.
Of course, with this in mind, your team isn't restricted to a simple on or off approach. Using DevCycle, a team can have numerous Variations which are released and tested at the same time, giving an even deeper view with more flexibility.
Using Experimentation
To run an Experiment on any Feature, all you need is two things:
- At least two Variations served to your users
- At least one Metric defined and attached to your Feature
Comparing Multiple Variations
The primary concept of an Experiment is the need to have at least two different experiences to compare performances. There are several ways in DevCycle to run multiple experiences for users. We go into depth on this in our Targeting documentation.
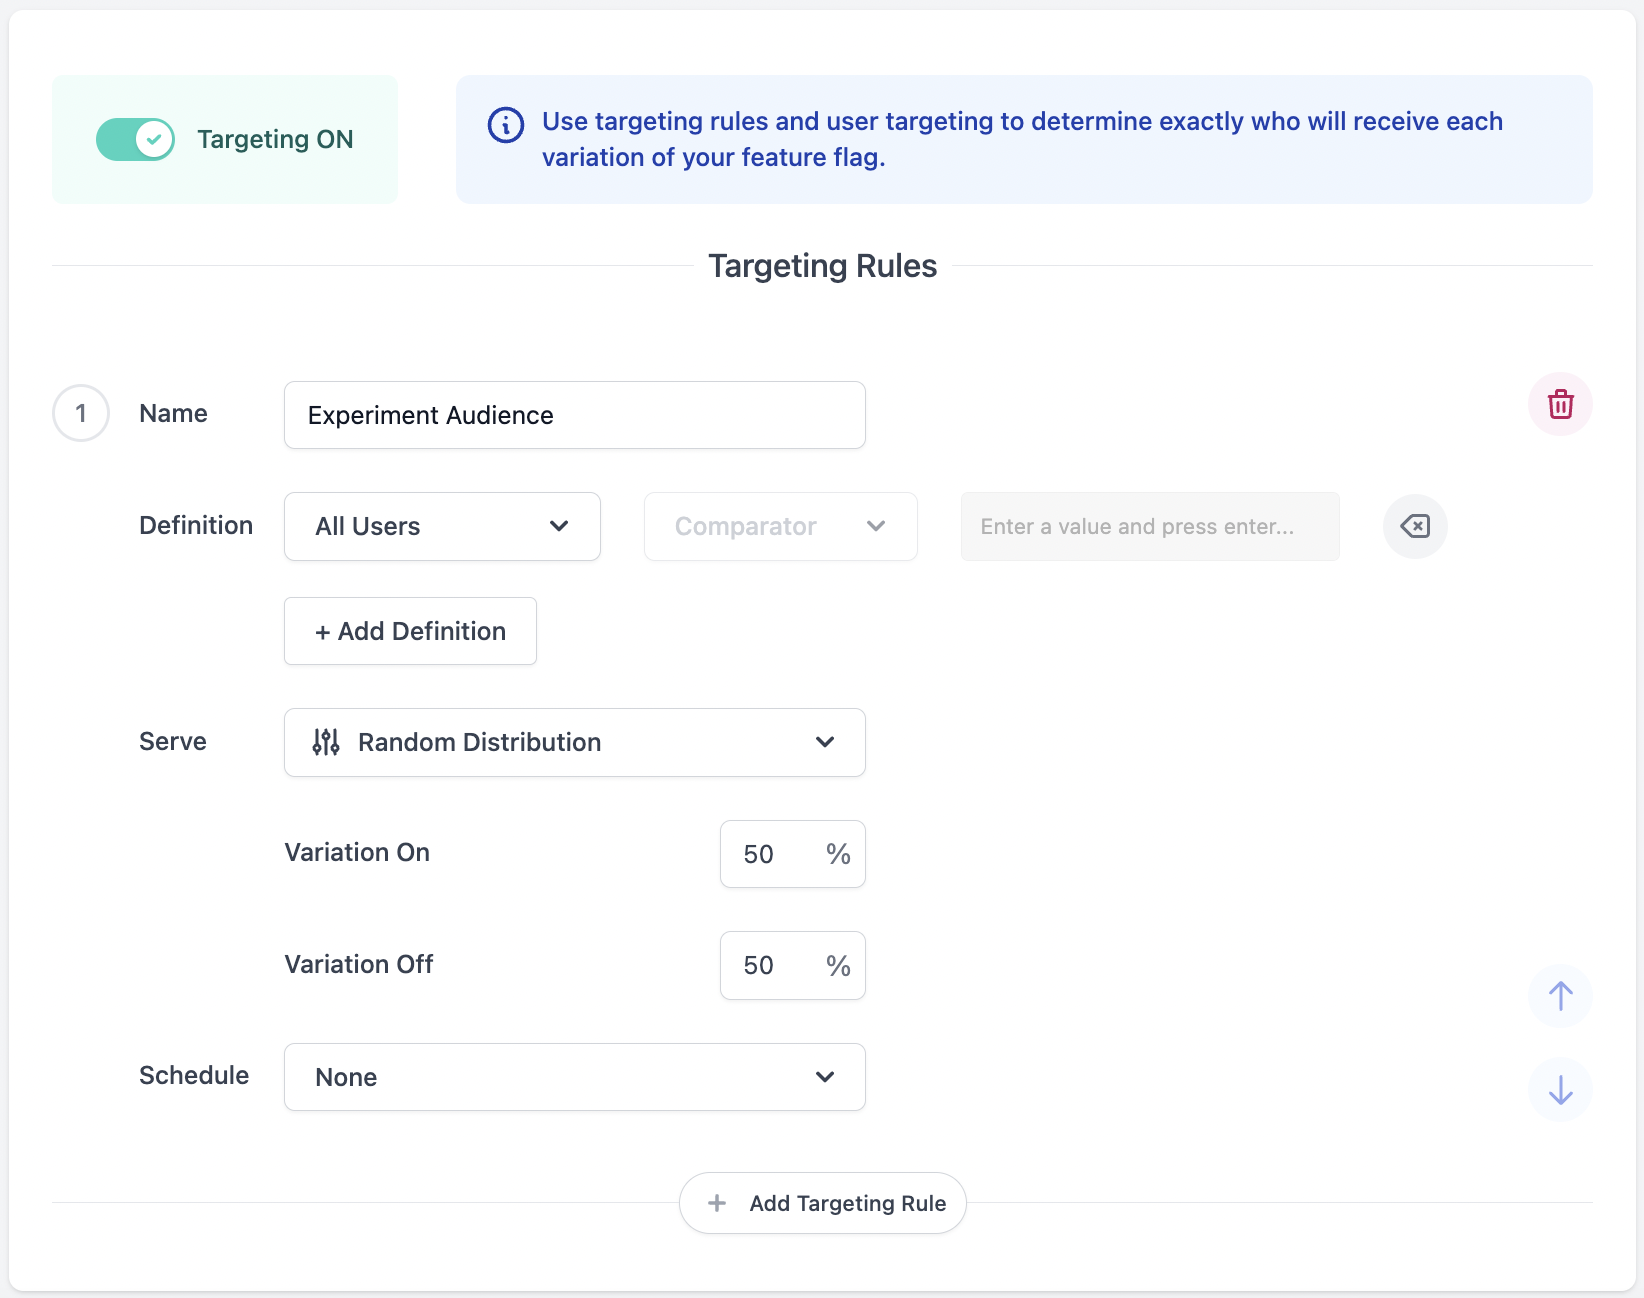
To get started with your first Feature Experiment, it is best to keep it simple and run a basic A/B test comparing two Variations, one control and one treatment Variation, delivered randomly to all your users.
To set this up, create a targeting rule in Production that delivers to All Users and serves Variations randomly with percentages set equally at 50% against your first Variation, and 50% against your second Variation.
Adding Metrics to Your Feature
Experimentation relies on Custom Events. Experimentation is available to all customers on any plan. However, to perform Experiments, events must be sent to DevCycle to calculate Metrics. These events are added to your existing plan. To learn more, read about our pricing, or contact us.
Now that you have two segments receiving different experiences, the only other thing you need to run an Experiment is a Metric to evaluate the comparative performance of those experiences.
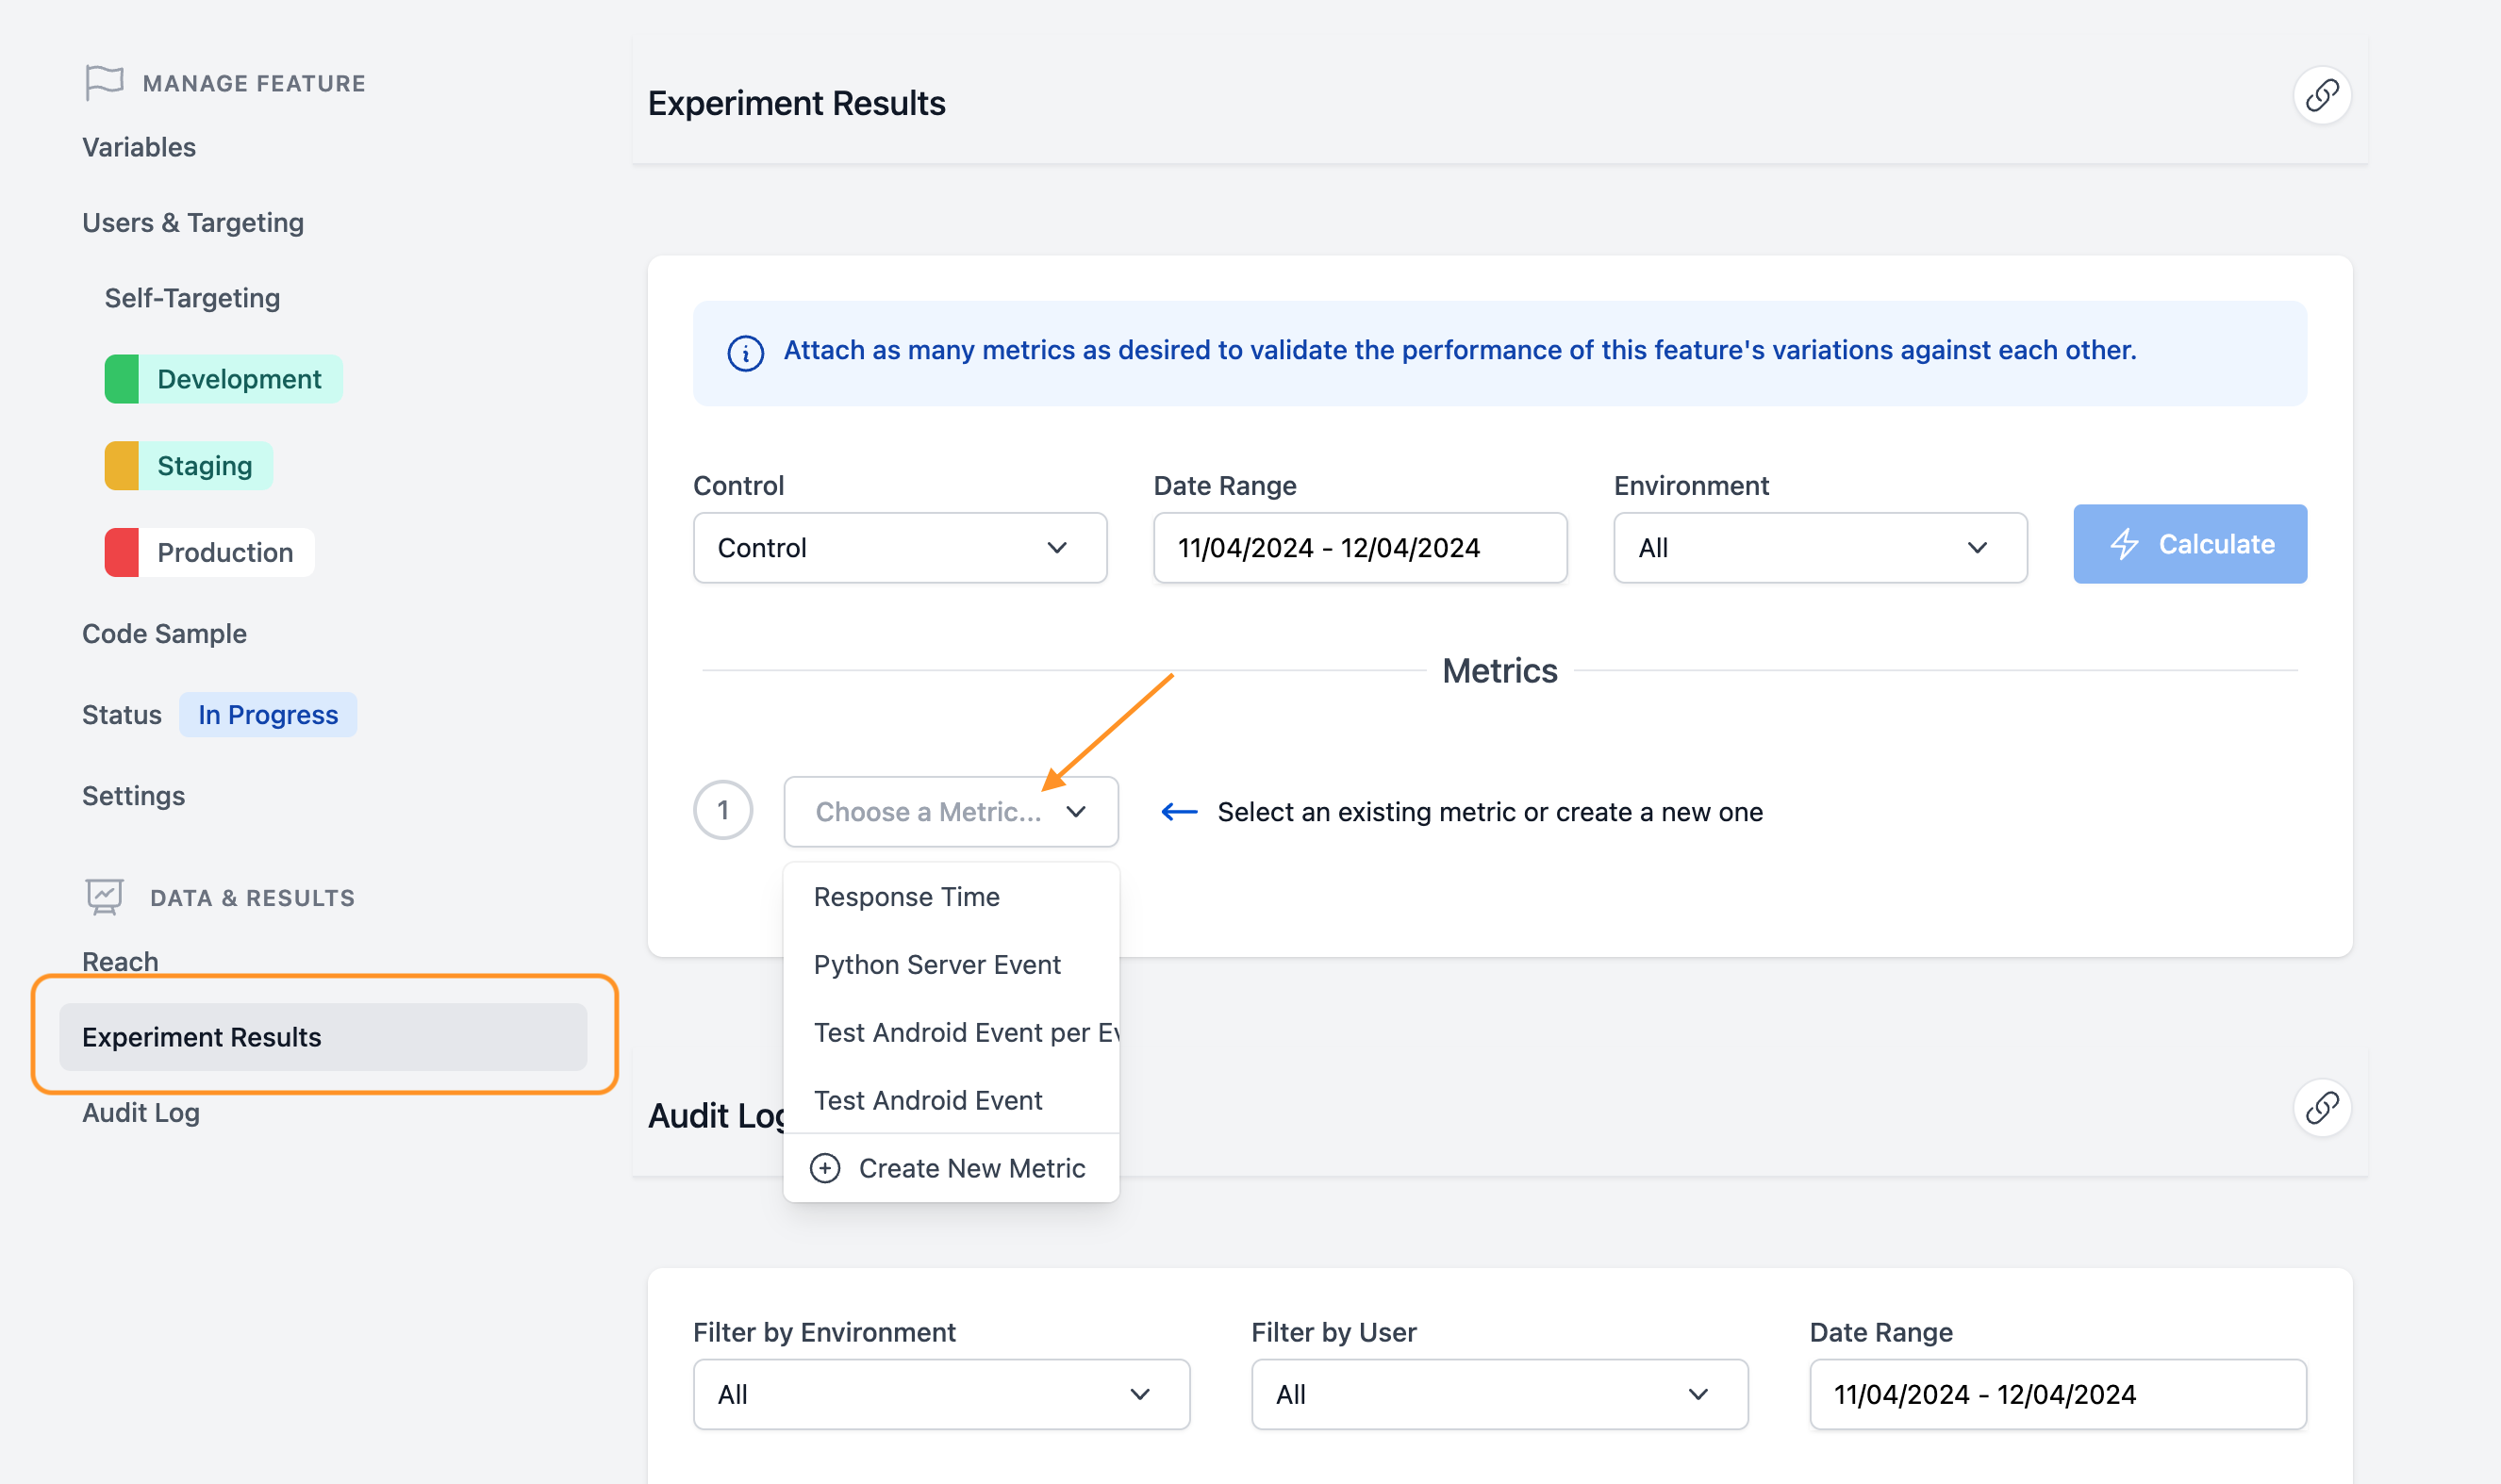
To add a Metric to your Feature, click “Experiment Results” under the “Data & Results” section on the sidebar of the Feature editing page. Click the “Choose a Metric” dropdown. This will bring up the option to add a Metric that has already been created in the Project or to create a new one.
For the creation of new Metrics check out our documentation here.
Once you have Metrics in your Project, all you need to do is:
- Select a Metric you want to use to judge the performance of your Experiment
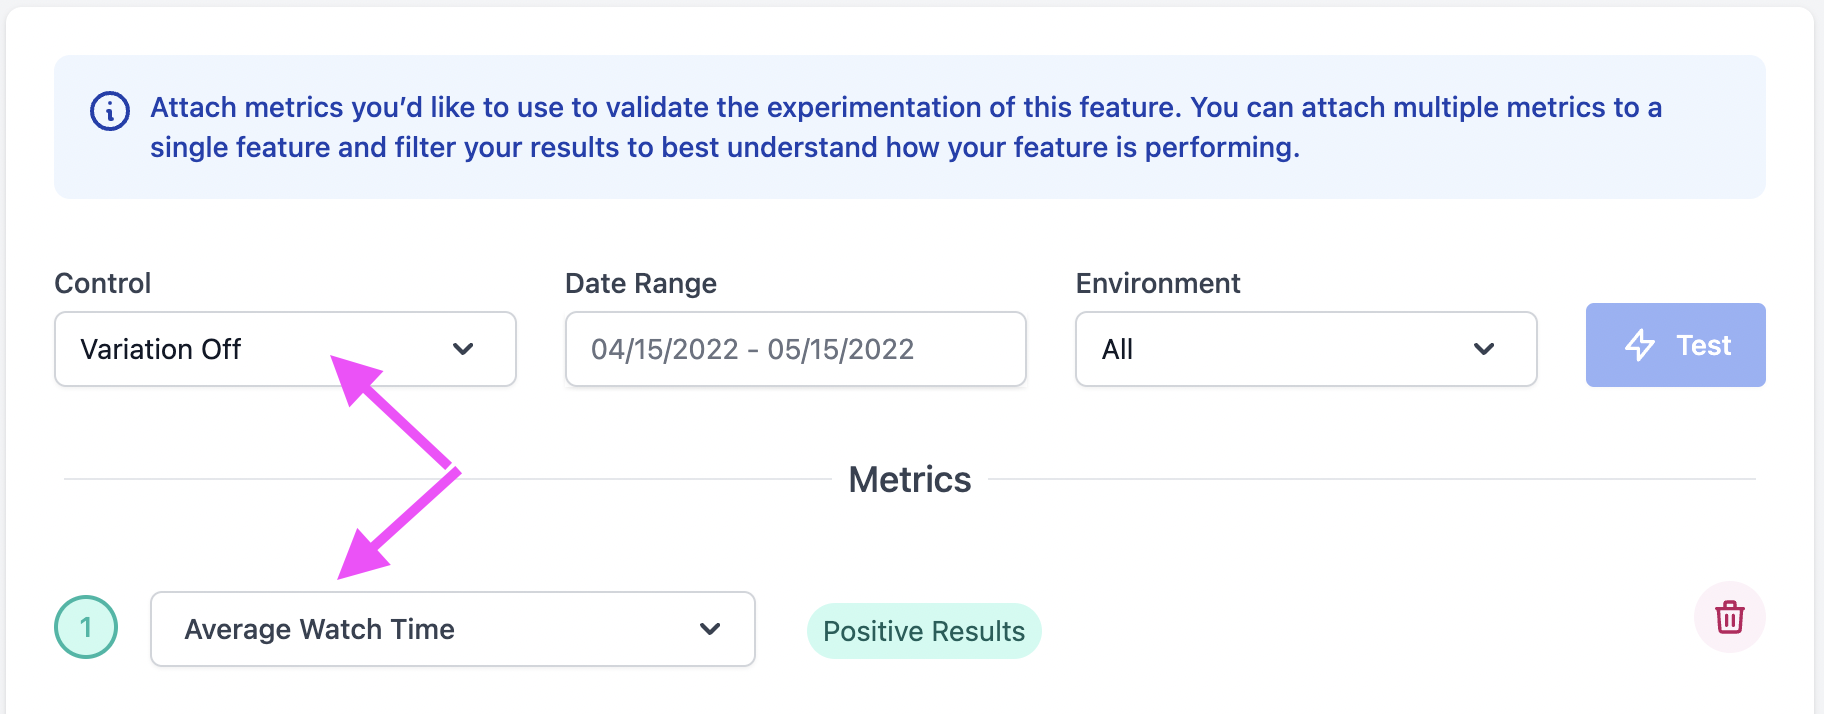
- Set the Variation that you want to use as your control Variation
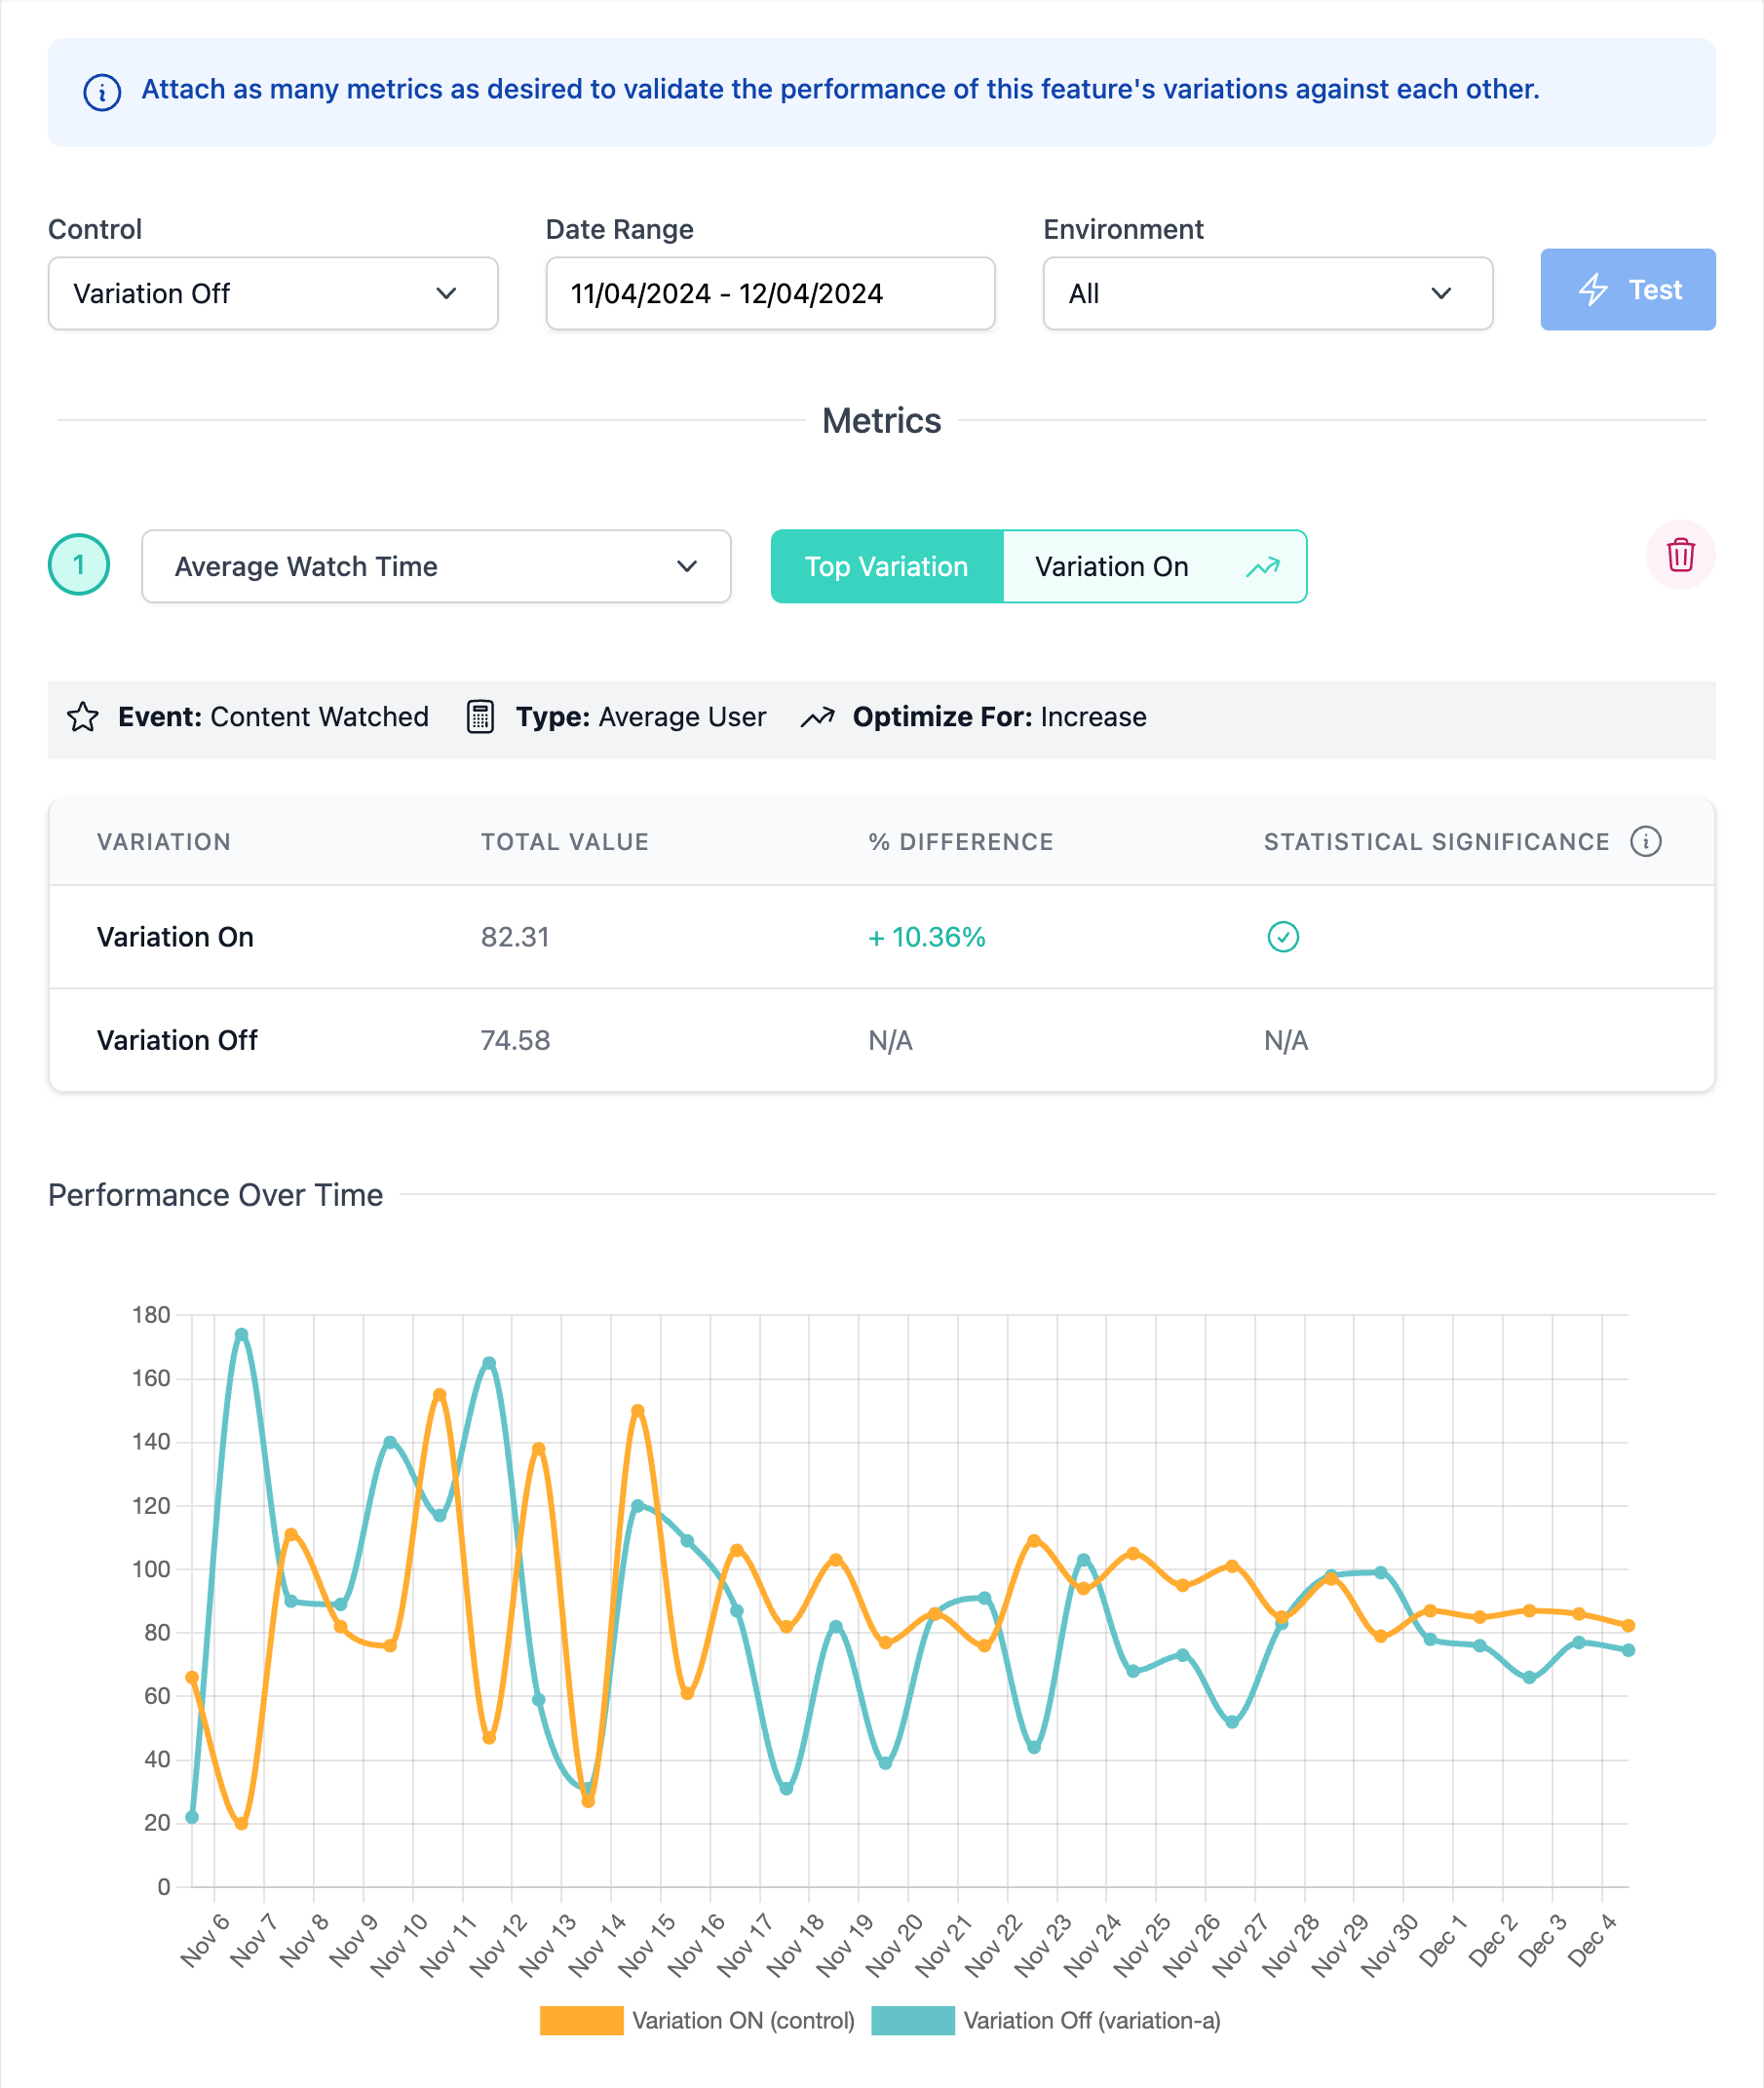
Now that you have a Metric added and a control Variation selected, the performance of the Experiment will be tracked over time. The performance of the treatment Variation compared to the control Variation will be tracked by the Difference and Statistical Significance indicator in real-time as the Experiment progresses.
Any number of Metrics can be added to a Feature for analysis, keep clicking “Choose a Metric” and add pre-existing or create new Metrics as needed.
Determining a Winner
The most important part of an Experiment is determining a winner.
The length of time an Experiment needs to run to determine a winner varies depending on the overall traffic, the observed conversion rate, and the size of the difference in conversion or values between the Variations. Typically Experiments should be run for a minimum of 1-2 weeks to achieve valid statistical significance with a good amount of time to get a proper cross-section of your user base.
Given the time it takes, your team should generally avoid early analysis and create a process by which an Experiment runs with no review of results until a pre-determined amount of time has passed.
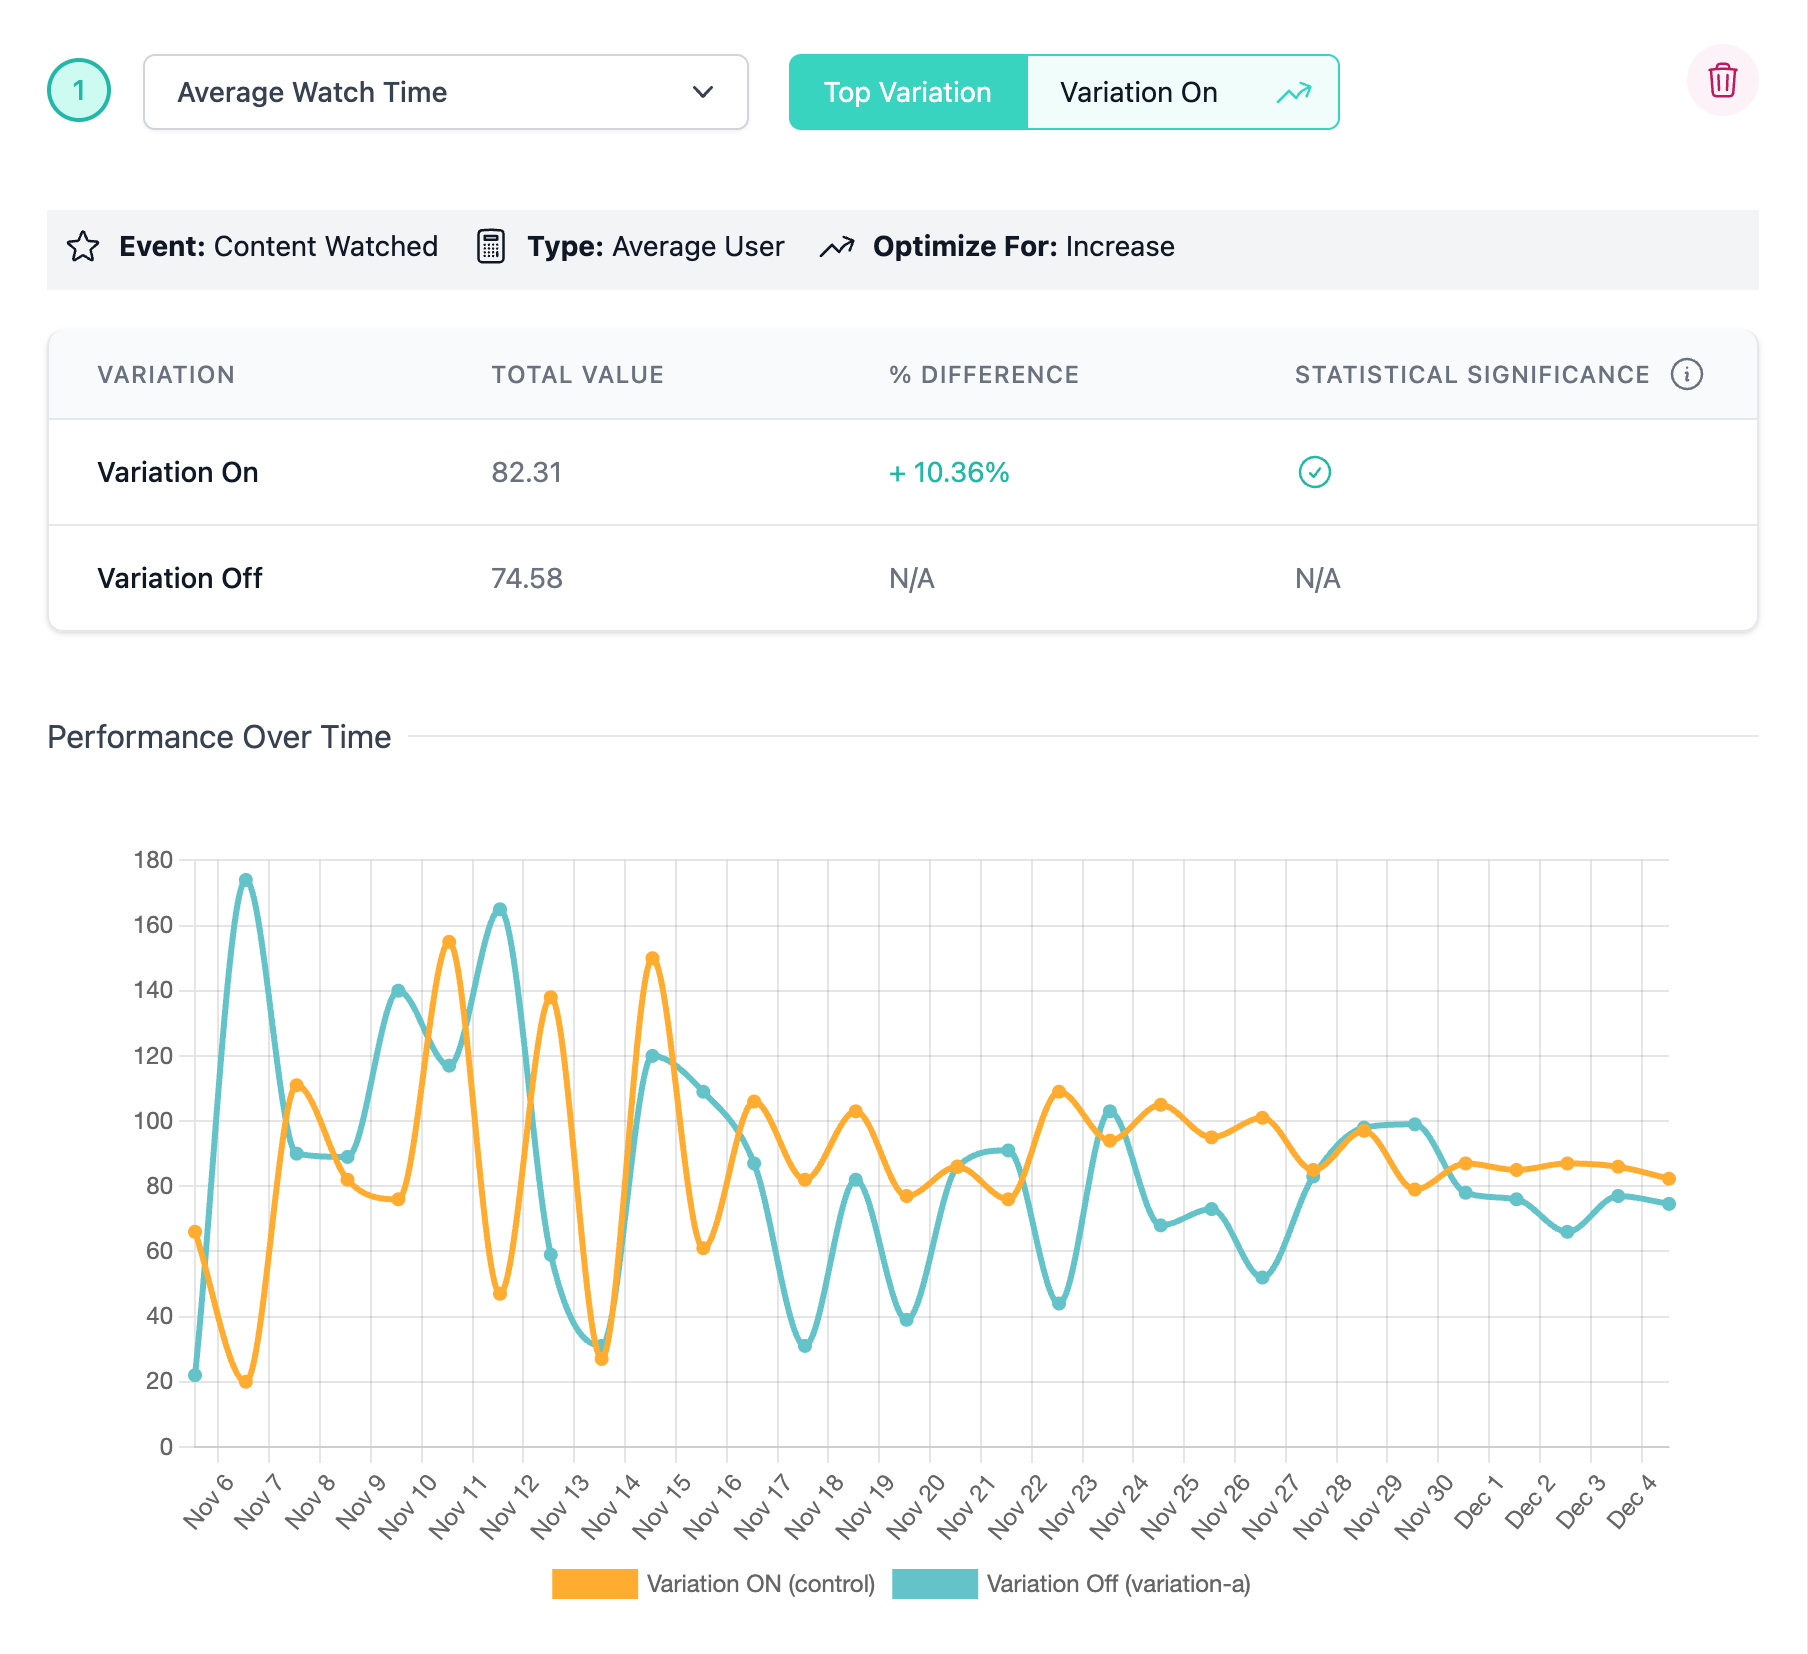
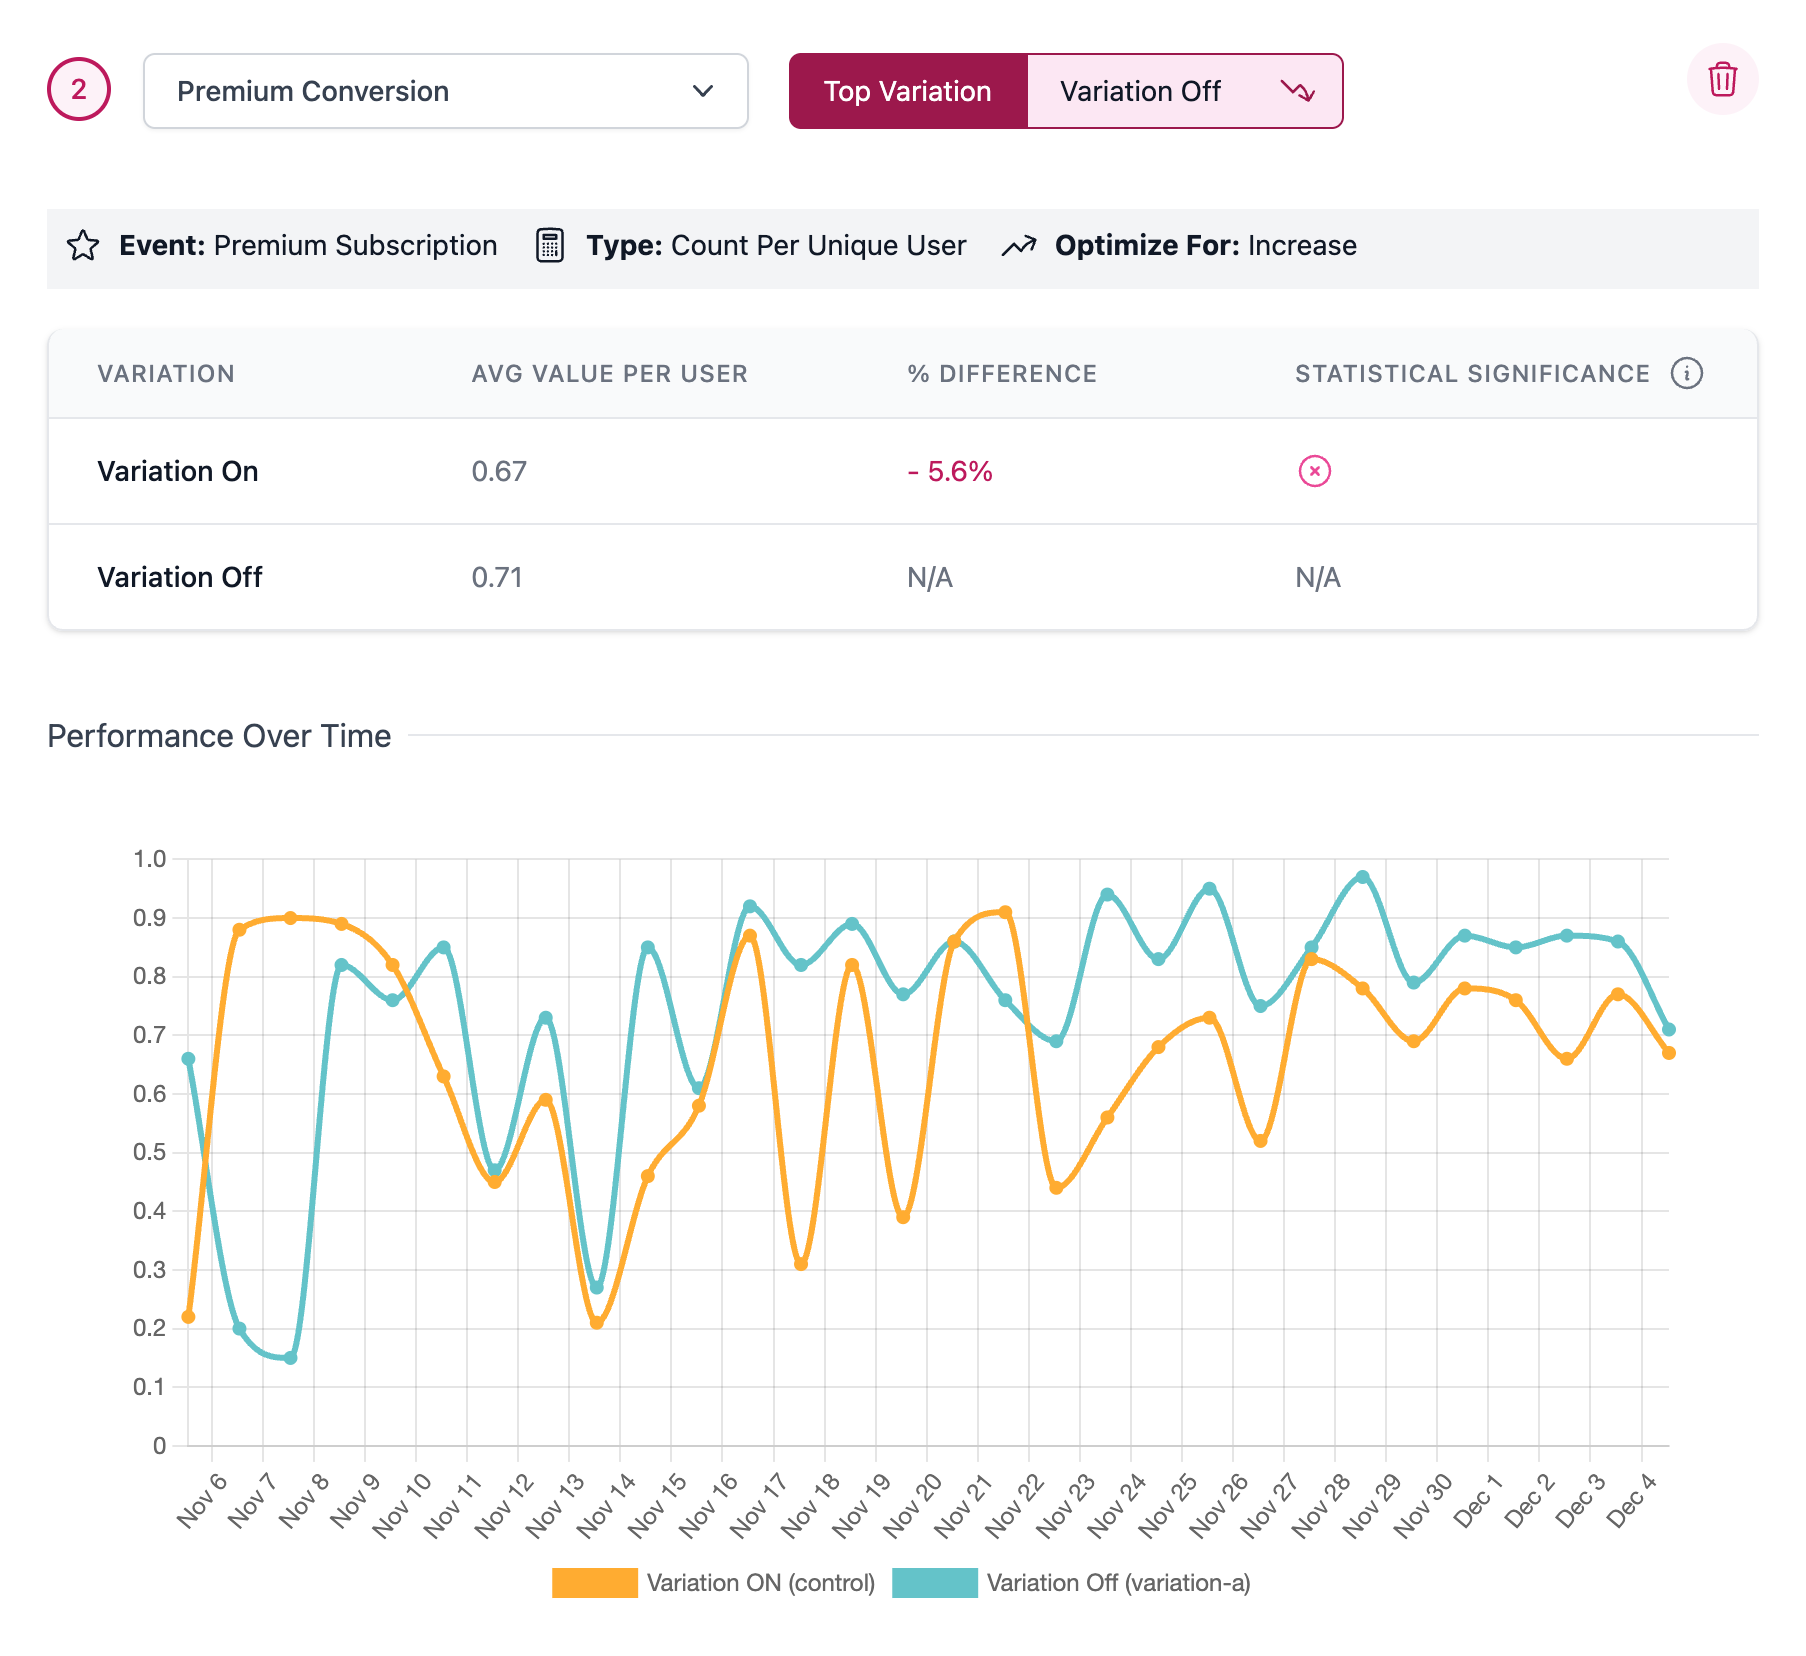
Once this time has passed, the charts and graphs for any added Metrics can be reviewed to determine which Variation performed best. When Metrics are created, you define if a decrease or an increase is the targeted improvement. Our results graphs take this into account and show clearly if the Metrics have driven either positive or negative results. The charts also provide guidance on if statistical significance has been achieved by displaying the following indicators.
| Statistical Significance | Definition |
|---|---|
| ✅ | Positive Significant Result |
| ❌ | Negative Significant Result |
| ... | Non-Significant Result |
Positive Results
Negative Results
Experimentation using a Custom Property for Randomization
For documentation on this functionality outside of the context of experimentation you can check out our documentation dedicated to this topic here.
DevCycle typically uses the User ID as the primary key for Feature rollouts and randomization. However, in certain scenarios, Features you release are intended to be rolled out to a cohort of users vs an individual user. For example, a new feature in a B2B platform might impact an entire Organization rather than a single user within that Organization. In such cases, you can randomize and rollout by using a Custom Property.
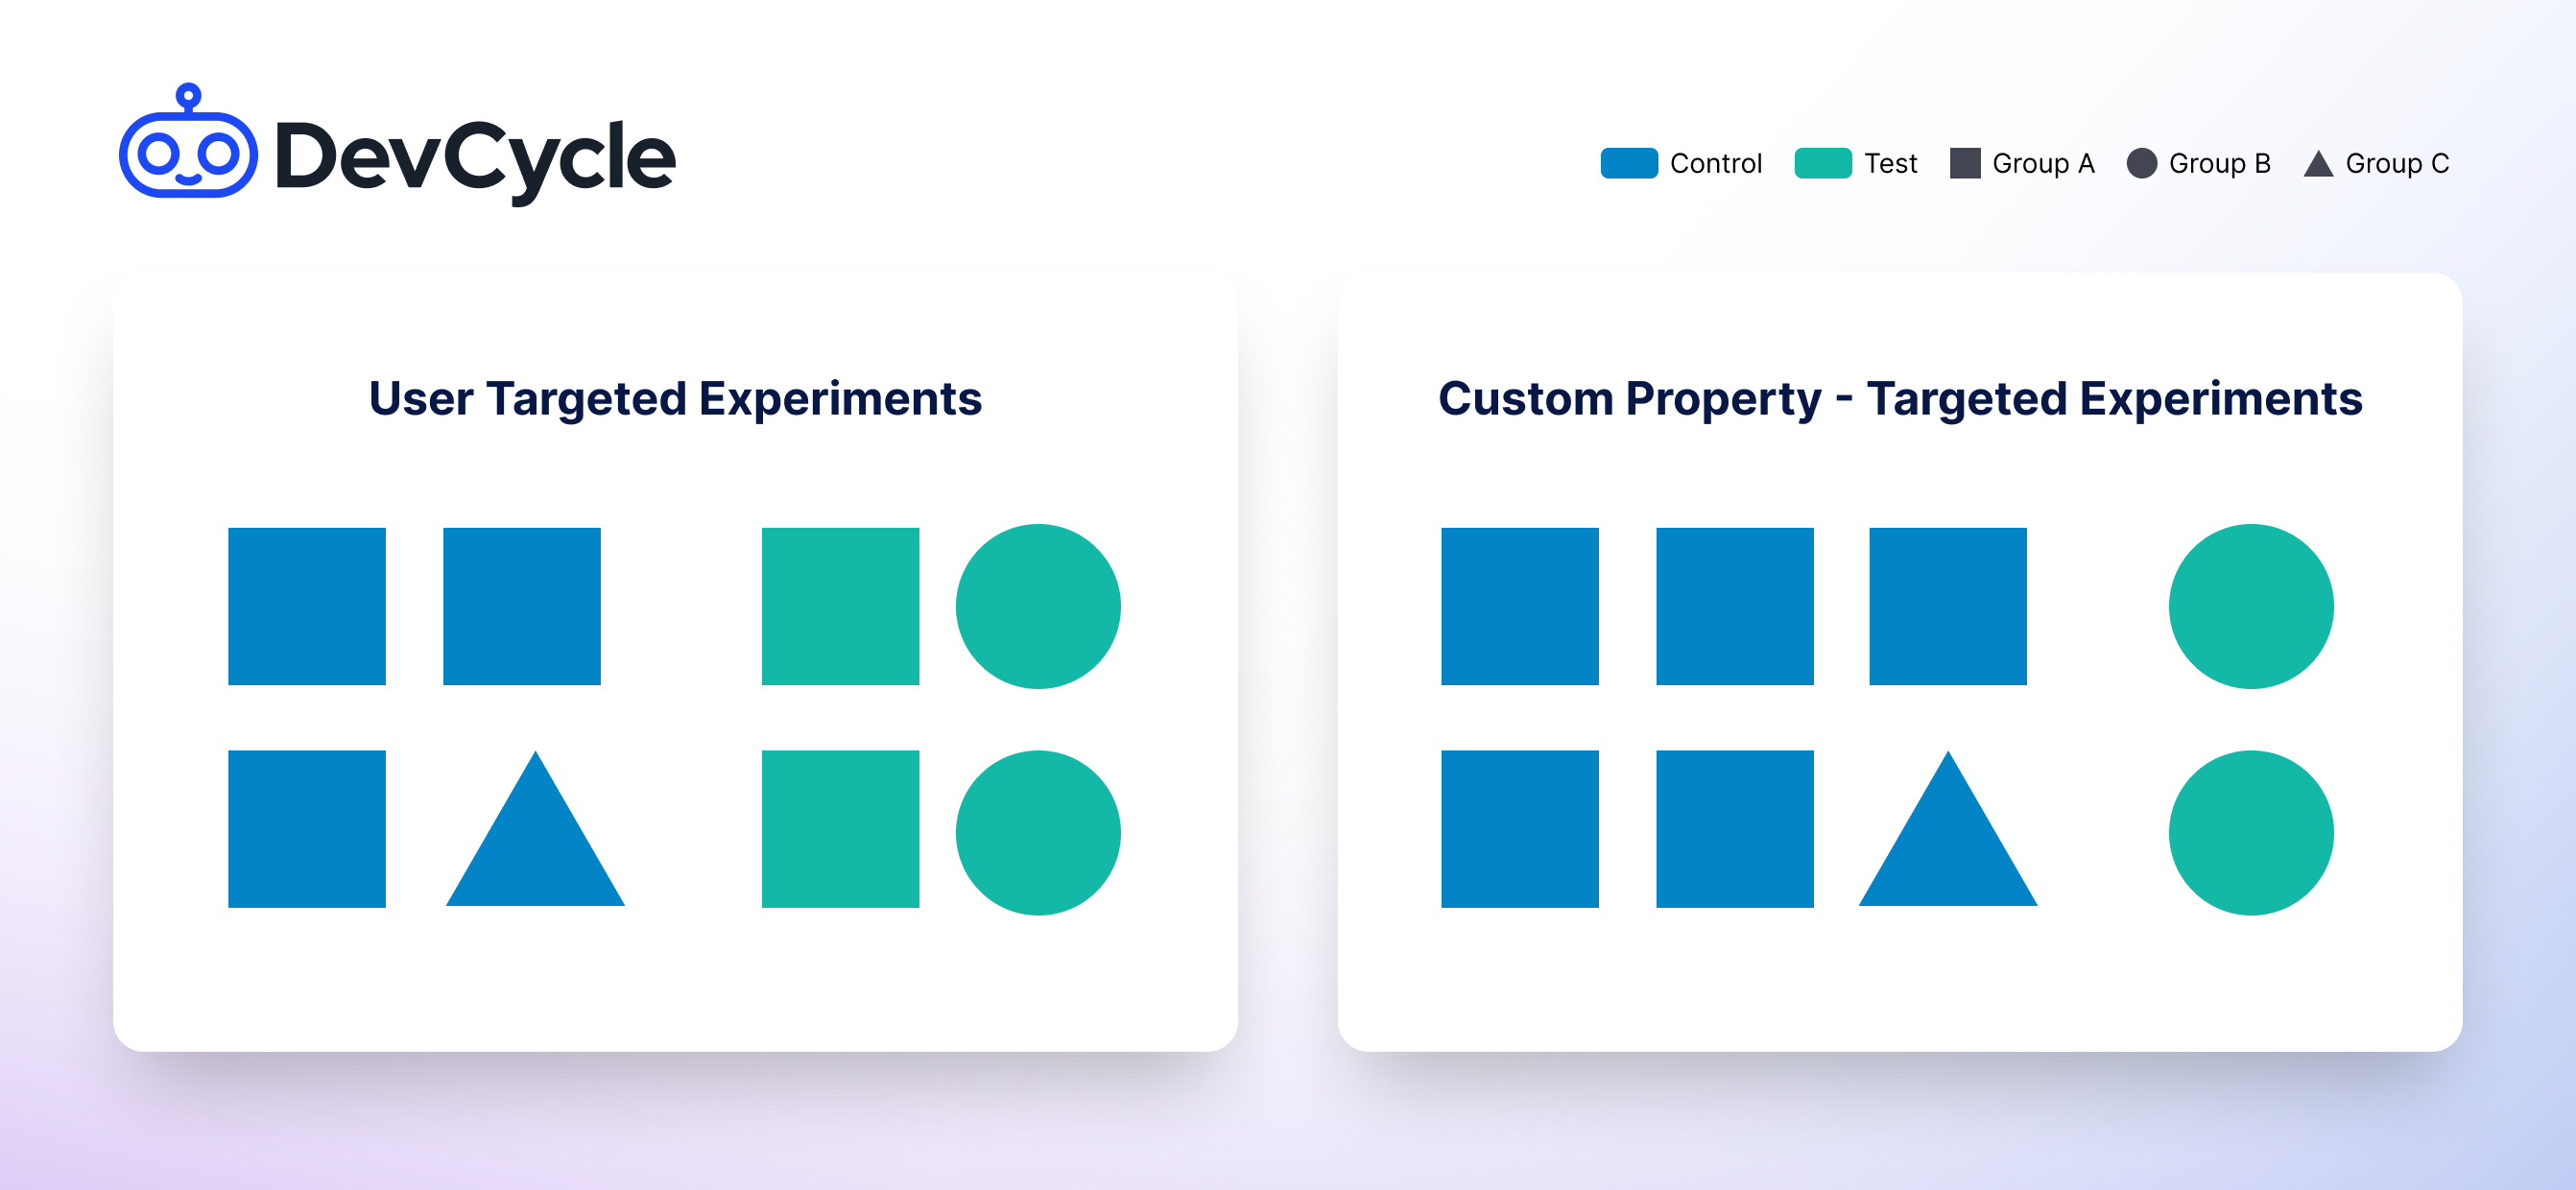
What are Experiments that Randomize Using a Custom Property?
When running an Experiment where you randomize using a Custom Property, the Experiment is applied to a set of users (those who possess a Custom Property) rather than individual users. This means that every user who has that Custom Property will experience the same Feature Variation, such as being part of the control or the test variant. This approach allows you to assess the impact of changes on the group as a whole.
Groups in DevCycle are defined using Custom Properties. These groups could be companies, tenants, geographic locations, or any set of users sharing common characteristics.
How to Randomize Using a Custom Property in Experiments
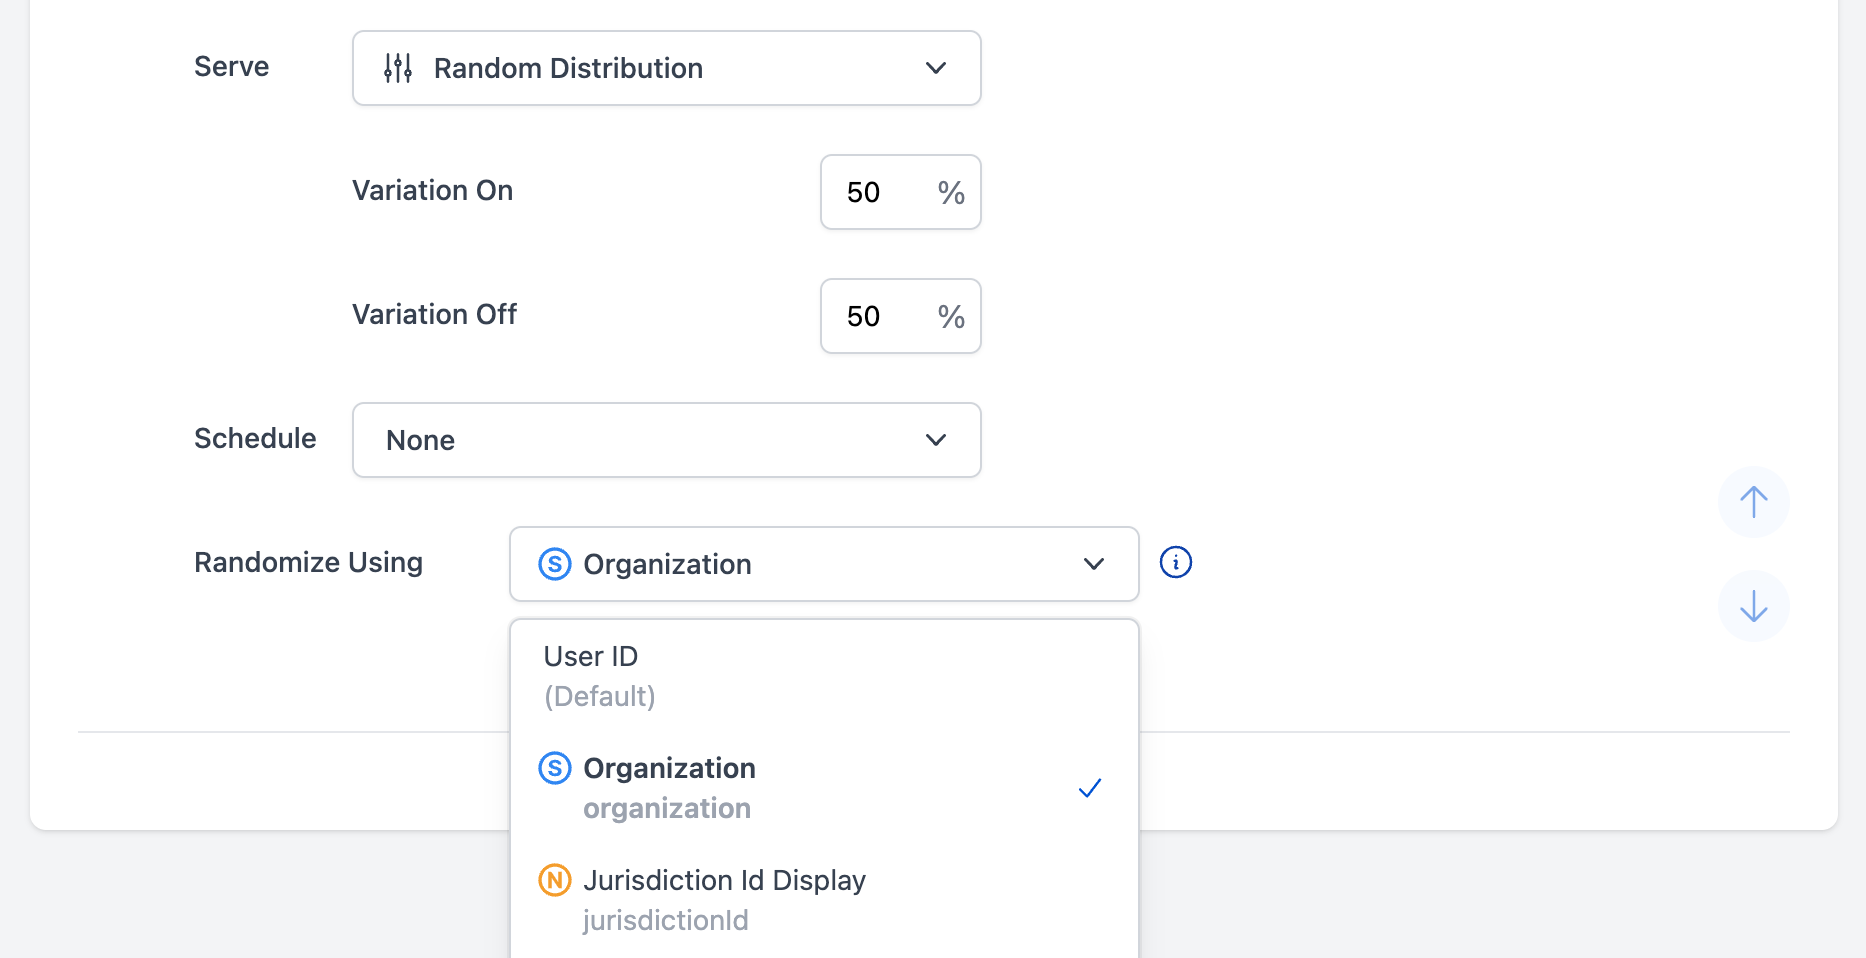
To set this up, create a Targeting Rule that serves a Random Distribution of the Variations.
When you select Random Distribution, Randomize Using field will appear at the bottom of the Targeting Rule under the Schedule section. The dropdown will populate with all existing Custom Properties. Select the Custom Property you wish to use for your random distribution. If you are both randomizing distribution and using a gradual rollout of some form, the Custom Property will be used for both forms of randomization, keeping distribution sticky based off of that property.
Risks to Experimentation
There are several risks to be aware of when randomizing your Experiments in this way:
-
Less Statistical Power: In Experiments with randomization using a Custom Property, each group is treated as a single data point, reducing the overall statistical power of the Experiment. For example, a platform might have millions of users but only a few thousand companies using it. This typically requires running these types of Experiments for a longer period to achieve statistically significant results.
-
Higher Randomization Risk: There's a greater risk of improper randomization when assigning Custom Properties to control or test variants. With fewer data points, any imbalance can significantly skew the results. For example, if a new pricing model is tested across different companies, an imbalance in the distribution of company sizes could lead to inaccurate conclusions about the model’s effectiveness.
-
Fewer User-Level Insights: Custom Property-targeted Experiments provide insights at an aggregate level, potentially obscuring user-level behaviors and preferences. For example, a new feature might increase overall usage within a company, but it might not reveal which specific roles or user types are most engaged with the feature.
-
Randomization Collisions: Our random distribution system works on a murmurhash, where we purposely limit User IDs to less than 200 characters to reduce the risk of collisions. If you randomize off of a Custom Property where the values are over 200 characters there is a potential for collisions that could impact randomization.
Regardless of the type of risk, if you are worried about the statistical validity of your Experiment you should make sure that there is both a significant number of groups as well as good balanced stratification across the groups that you're testing against. These two factors protect you against the most substantial risks.