Dynatrace
The DevCycle Dynatrace integration allows you to correlate Feature Flag changes and Flag evaluations with your Dynatrace instance. This provides visibility into Feature Flag states alongside other service monitoring data, making it easier to investigate and resolve issues.
The setup has two parts:
- Connect DevCycle to Dynatrace, so that Feature Flag change events appear in Dynatrace.
- Configure your application to send Flag Evaluations as part of the traces to Dynatrace
Part A: Setting up Dynatrace Integration on DevCycle to receive Flag change updates
Because Feature Flags can change independently of deployments, they often don't show up in your observability tools. Setting up this connection ensures that Feature Flag changes are logged in Dynatrace.
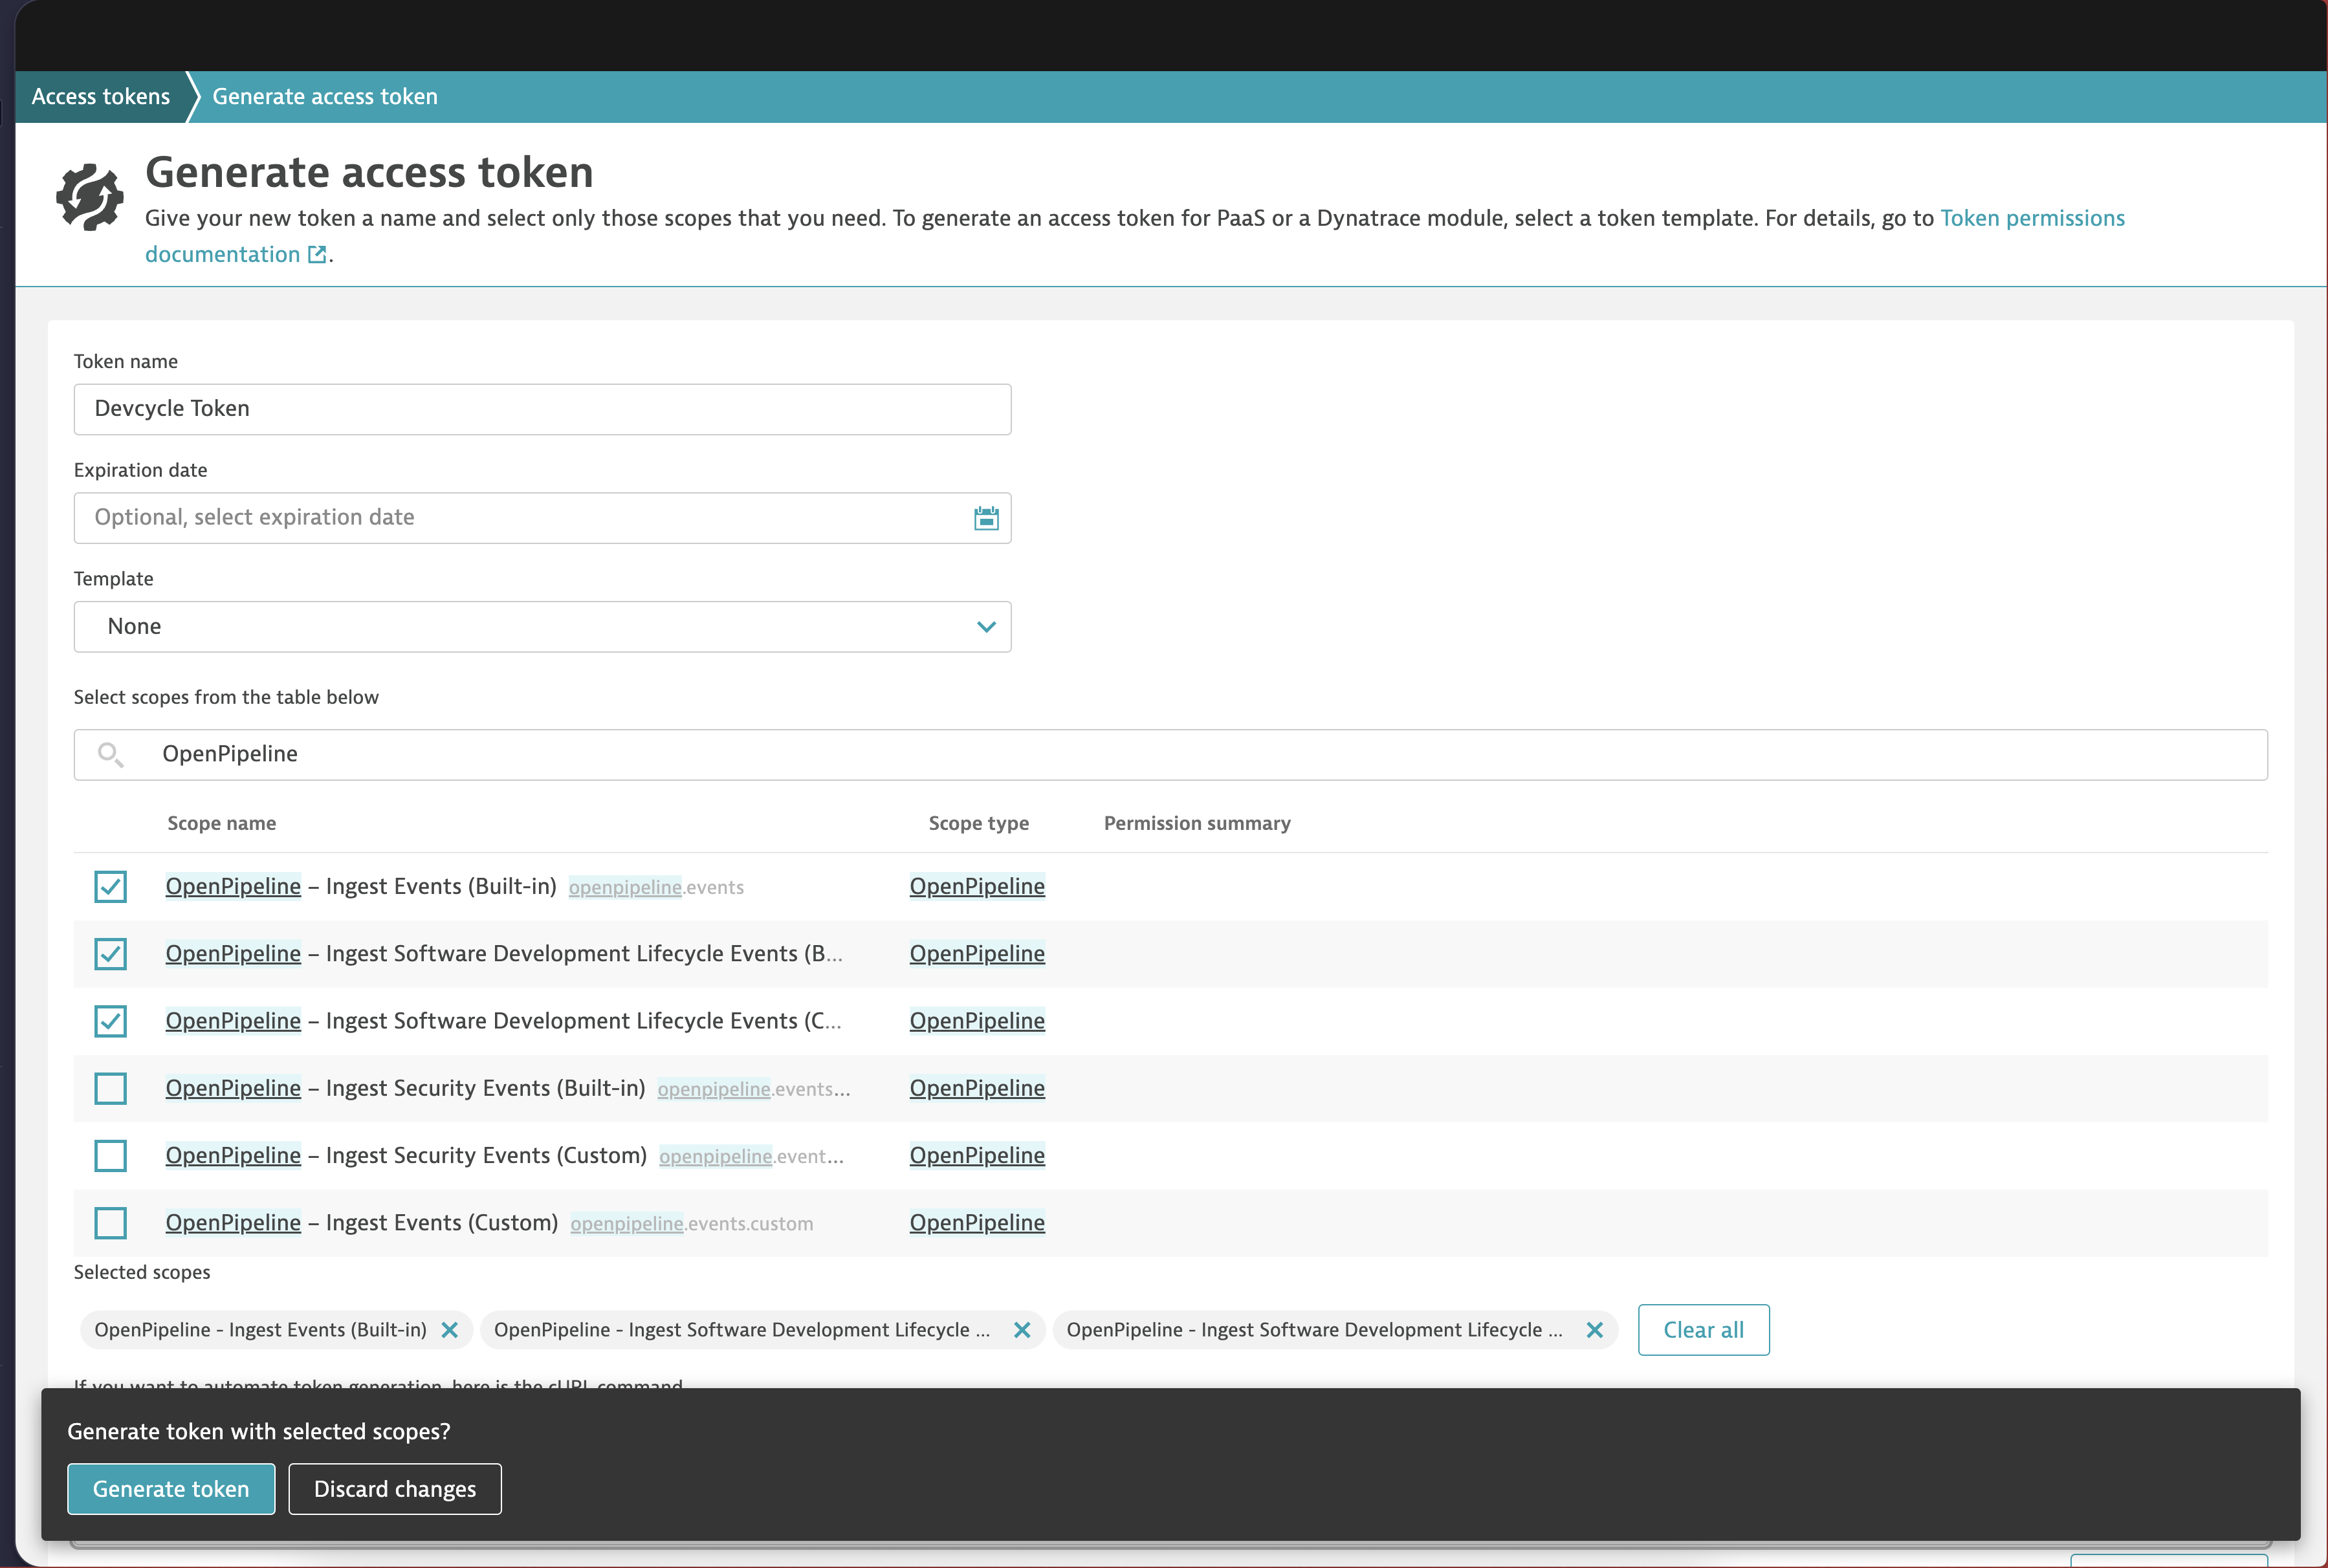
Step 1: Create a Dynatrace Access Token
- In Dynatrace, create a new token with the following scopes:
openpipeline.eventsopenpipeline.events_sdlcopenpipeline.events_sdlc.custom
- Save this token securely — you'll need it shortly.
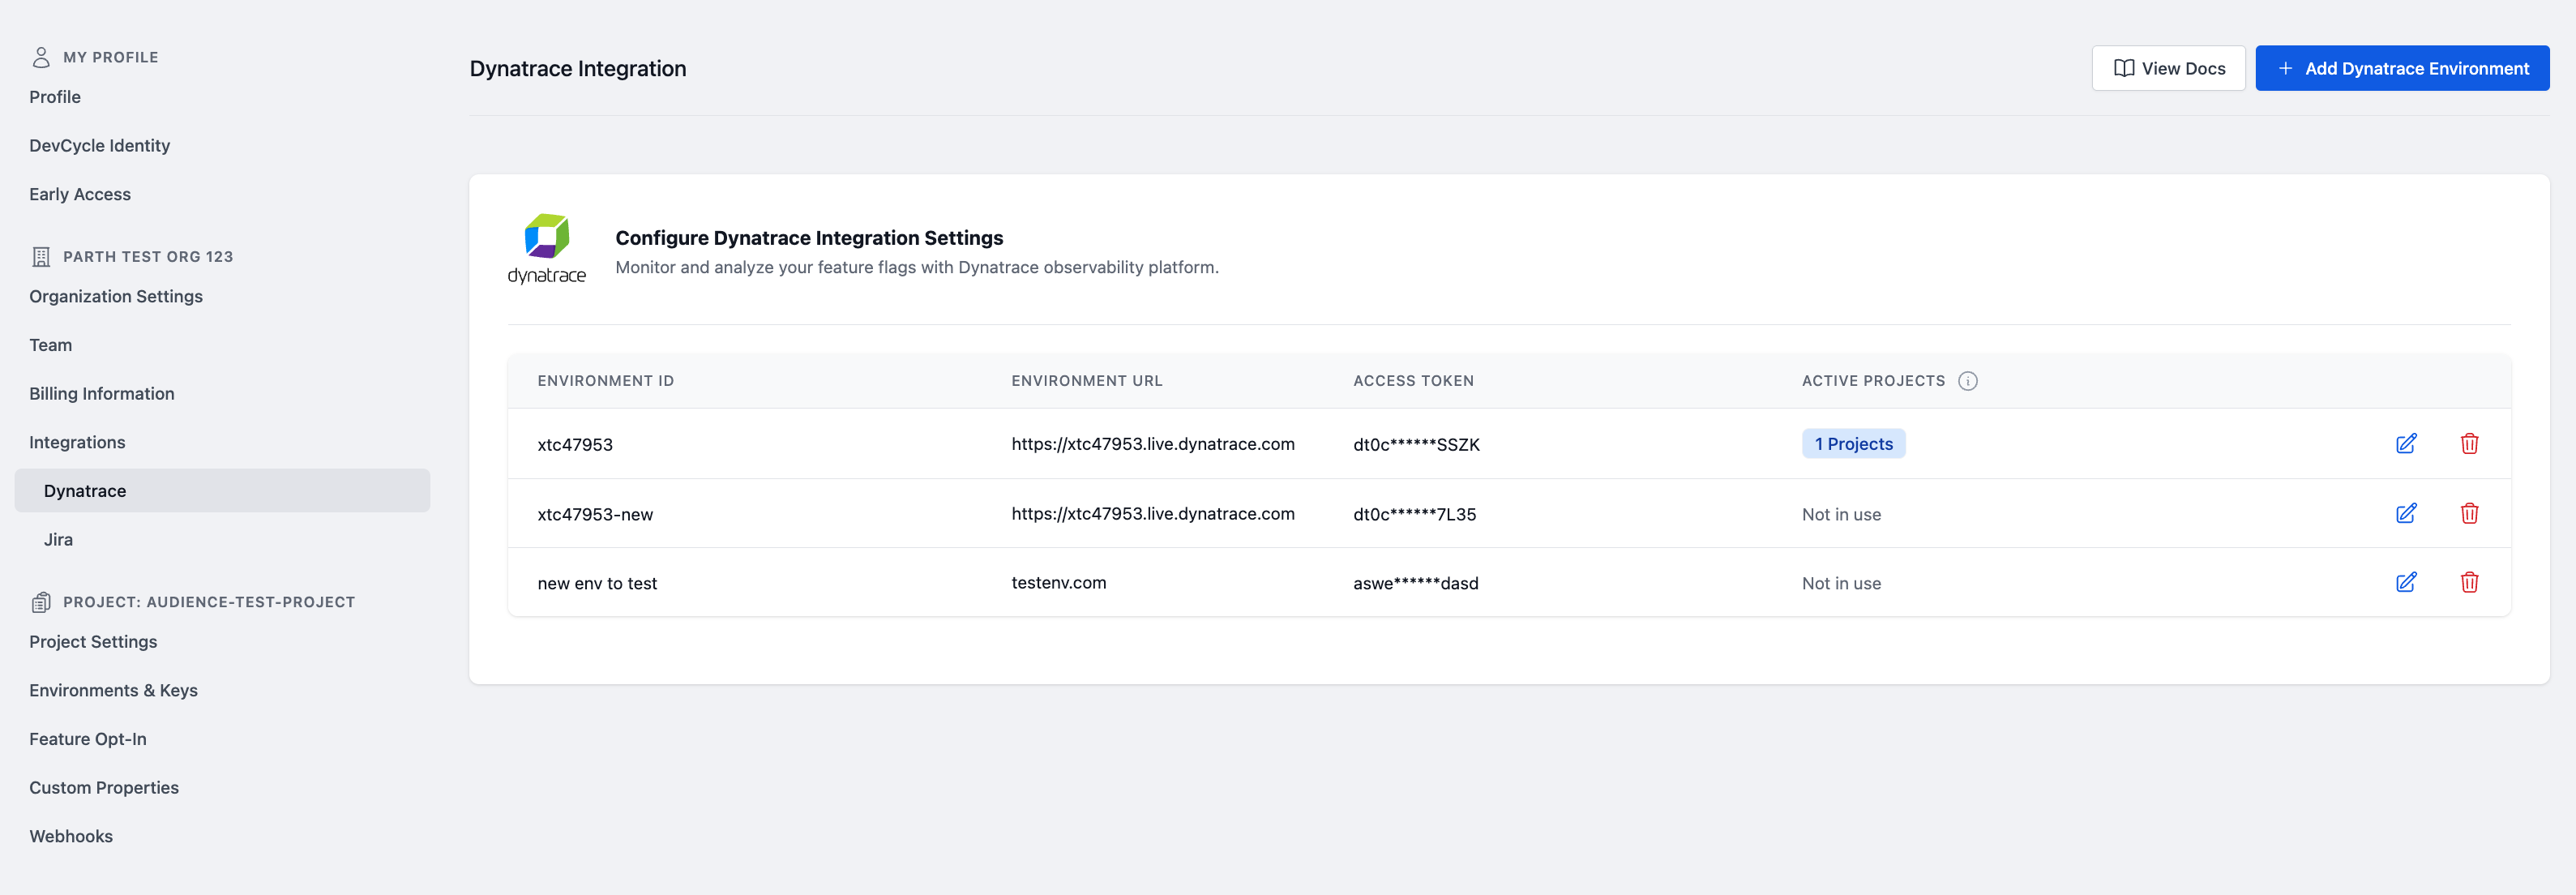
Step 2: Add Dynatrace Environment in DevCycle
Note: If Permissions are enabled for your Organization, only Organization Admins can perform this step.
-
Go to your DevCycle Organization Settings → Dynatrace in the left navigation.
-
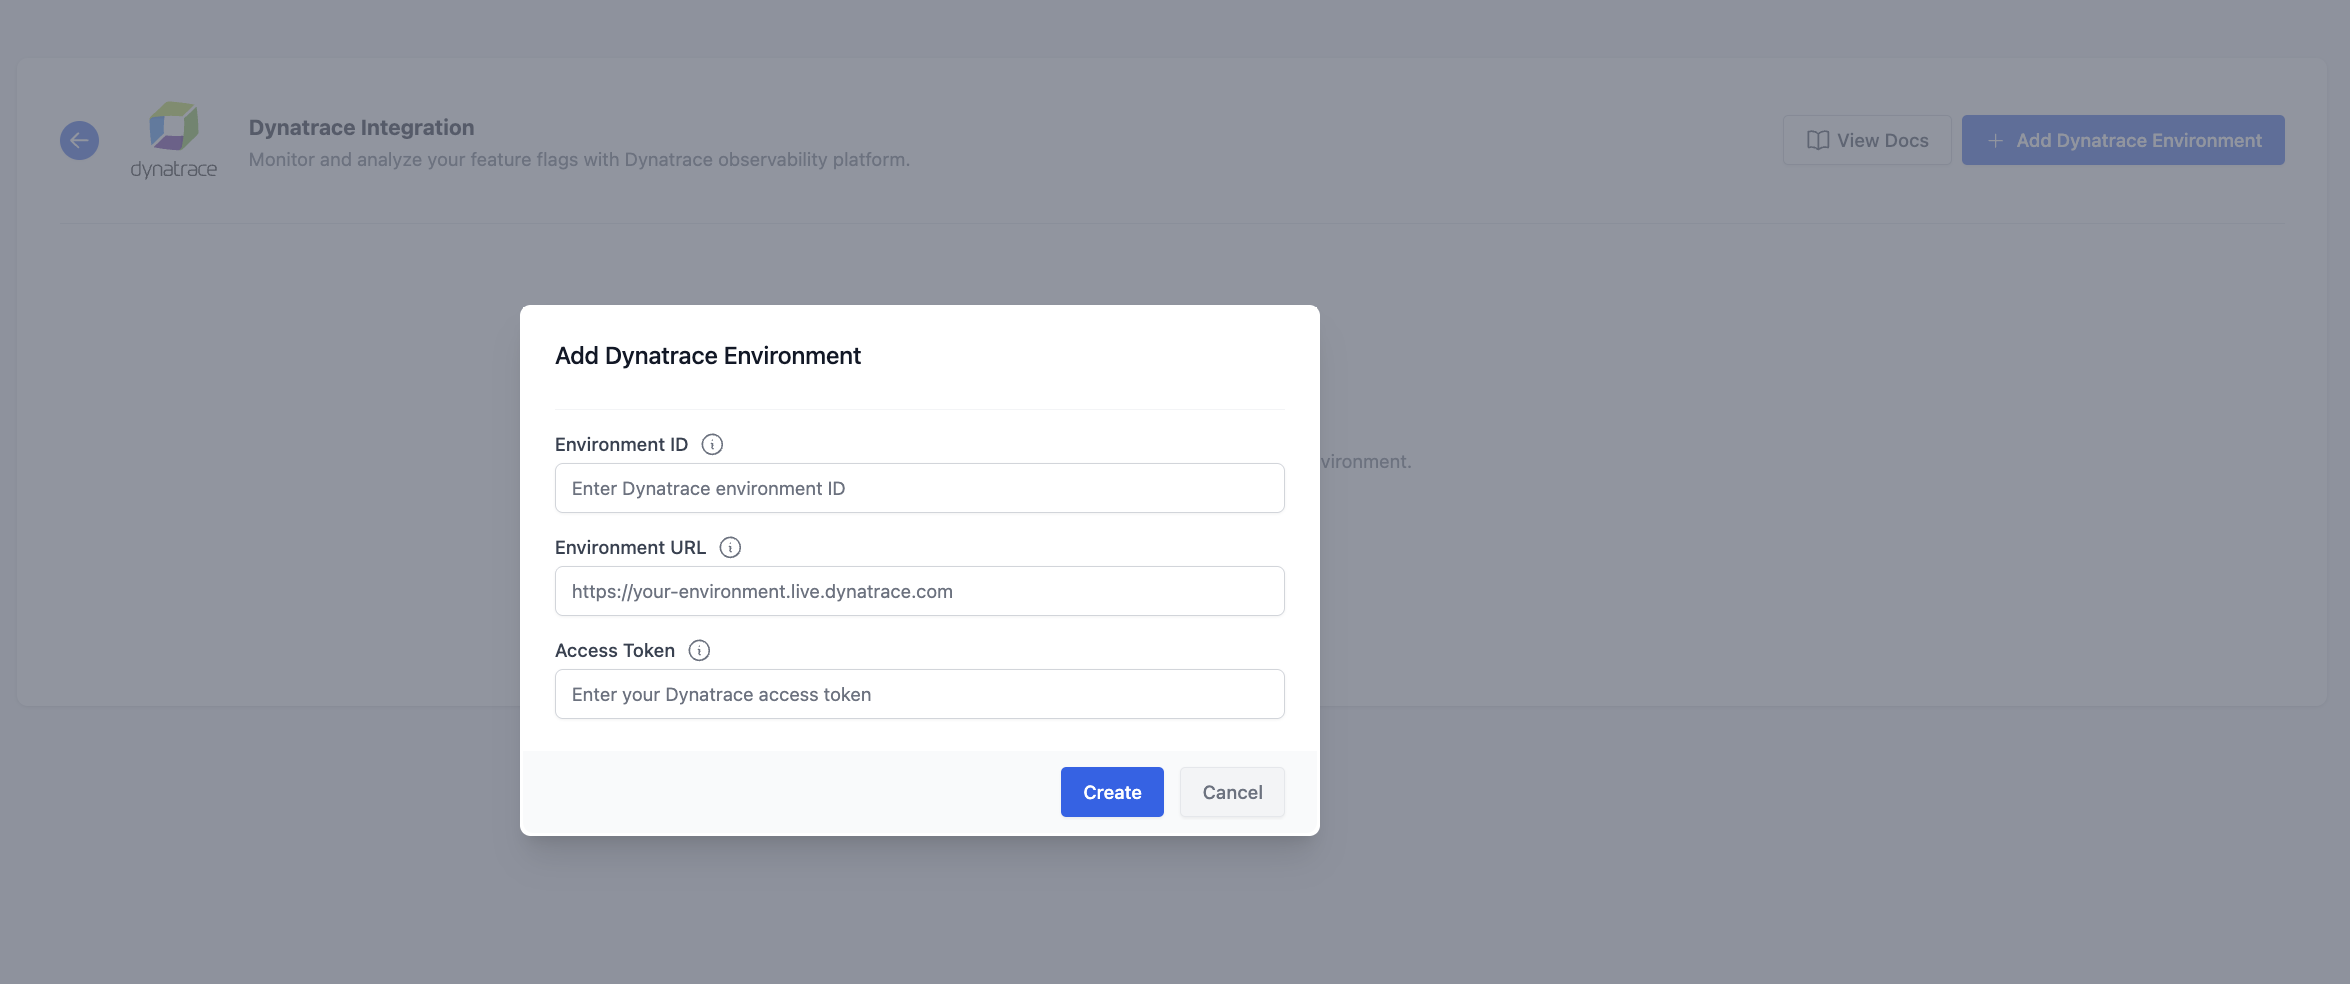
Click Add Dynatrace Environment and enter the following details:
- Environment ID
- Environment URL
- Access Token
-
Assign the Dynatrace Environment in the Project Settings for each Project you want to enable.
-
In Project Settings, you'll see the Dynatrace Integration card.
-
Enable the integration and manage Environment mapping.
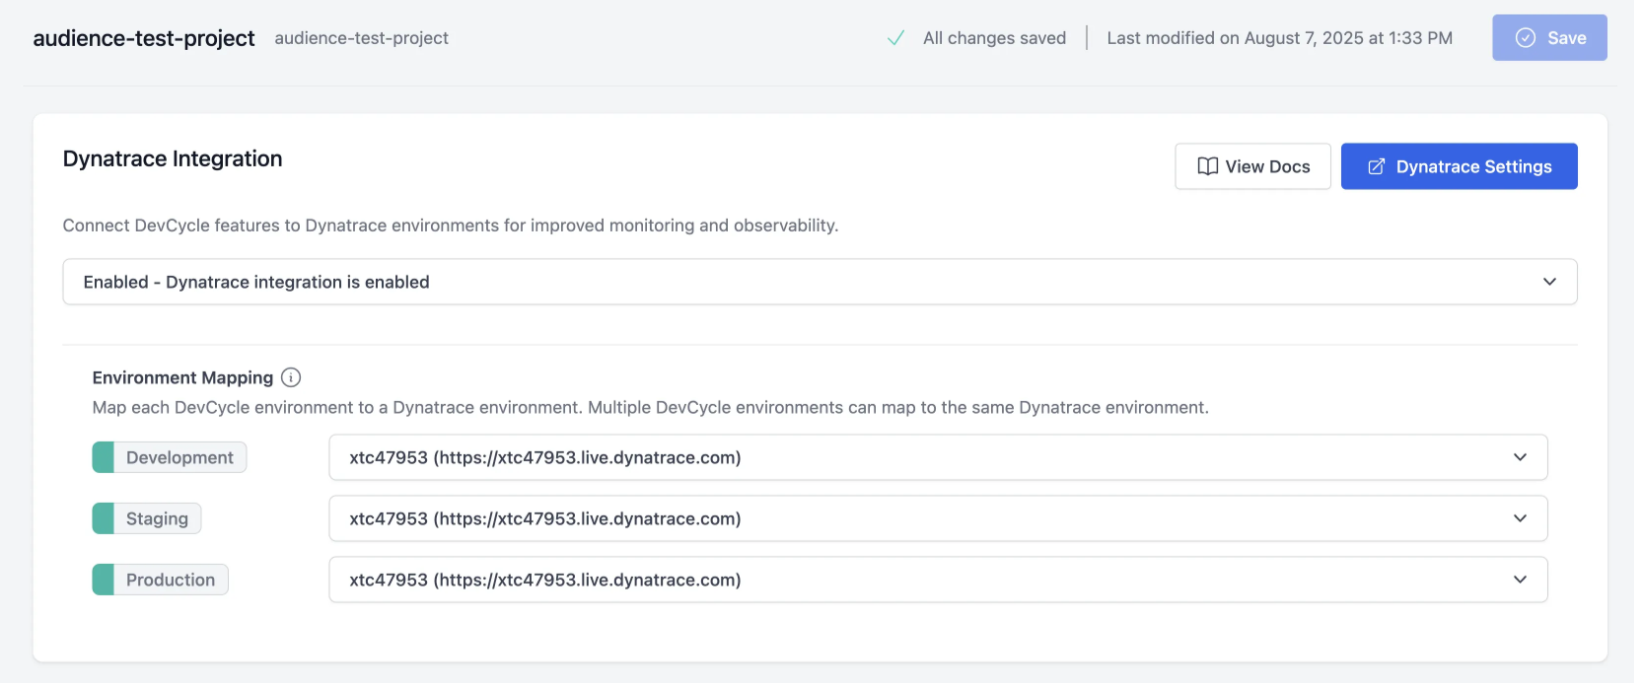
- Be sure to click Save after making changes.
Part B: Send Flag Evaluations from Your App
To capture Flag Evaluations in Dynatrace traces, DevCycle SDKs now support Evaluation Hooks.
Ensure you're using a supported SDK version:
dotnet DevCycle.SDK.Server.Local 4.8.1
java com.devcycle:java-server-sdk:2.9.0
python devcycle-python-server-sdk 3.13.0
go github.com/devcyclehq/go-server-sdk/v2 2.24.0
js @devcycle/nodejs-server-sdk 1.55.0
We provide ready-made Dynatrace integration hooks in this repo (Dynatrace Integration Hooks) for you to copy into your codebase.
These hooks are designed for Dynatrace OneAgent and are not supported in every language. Feel free to adapt them for your own use case.
To enable in the SDK, you will have to call the client's addHook method and pass in the hook to it.
Example: Add Hook in Java
// Create DevCycle client with default options
devCycleClient = new DevCycleLocalClient(devCycleServerSdkKey);

// Add Dynatrace OneAgent SDK hook for all variable types
DynatraceOneAgentLogHook hook = new DynatraceOneAgentLogHook();
devCycleClient.addHook(hook);
Example: Add Hook in C#
// Initialize DevCycle client with standard configuration
DevCycleLocalClient client = new DevCycleLocalClientBuilder()
    .SetSDKKey("<DEVCYCLE_SERVER_SDK_KEY>")
    .SetLogger(LoggerFactory.Create(builder => builder.AddConsole()))
    .Build();

// Initialize evaluation hook with an ActivitySource for tracing
var hook = new DynatraceOneAgentHook(new ActivitySource("DevCycle.FlagEvaluations"));
client.AddEvalHook(hook);
When enabled, Feature Flag evaluations generate spans named: feature_flag_evaluation.{feature_key} which will have the attributes for the evaluation.
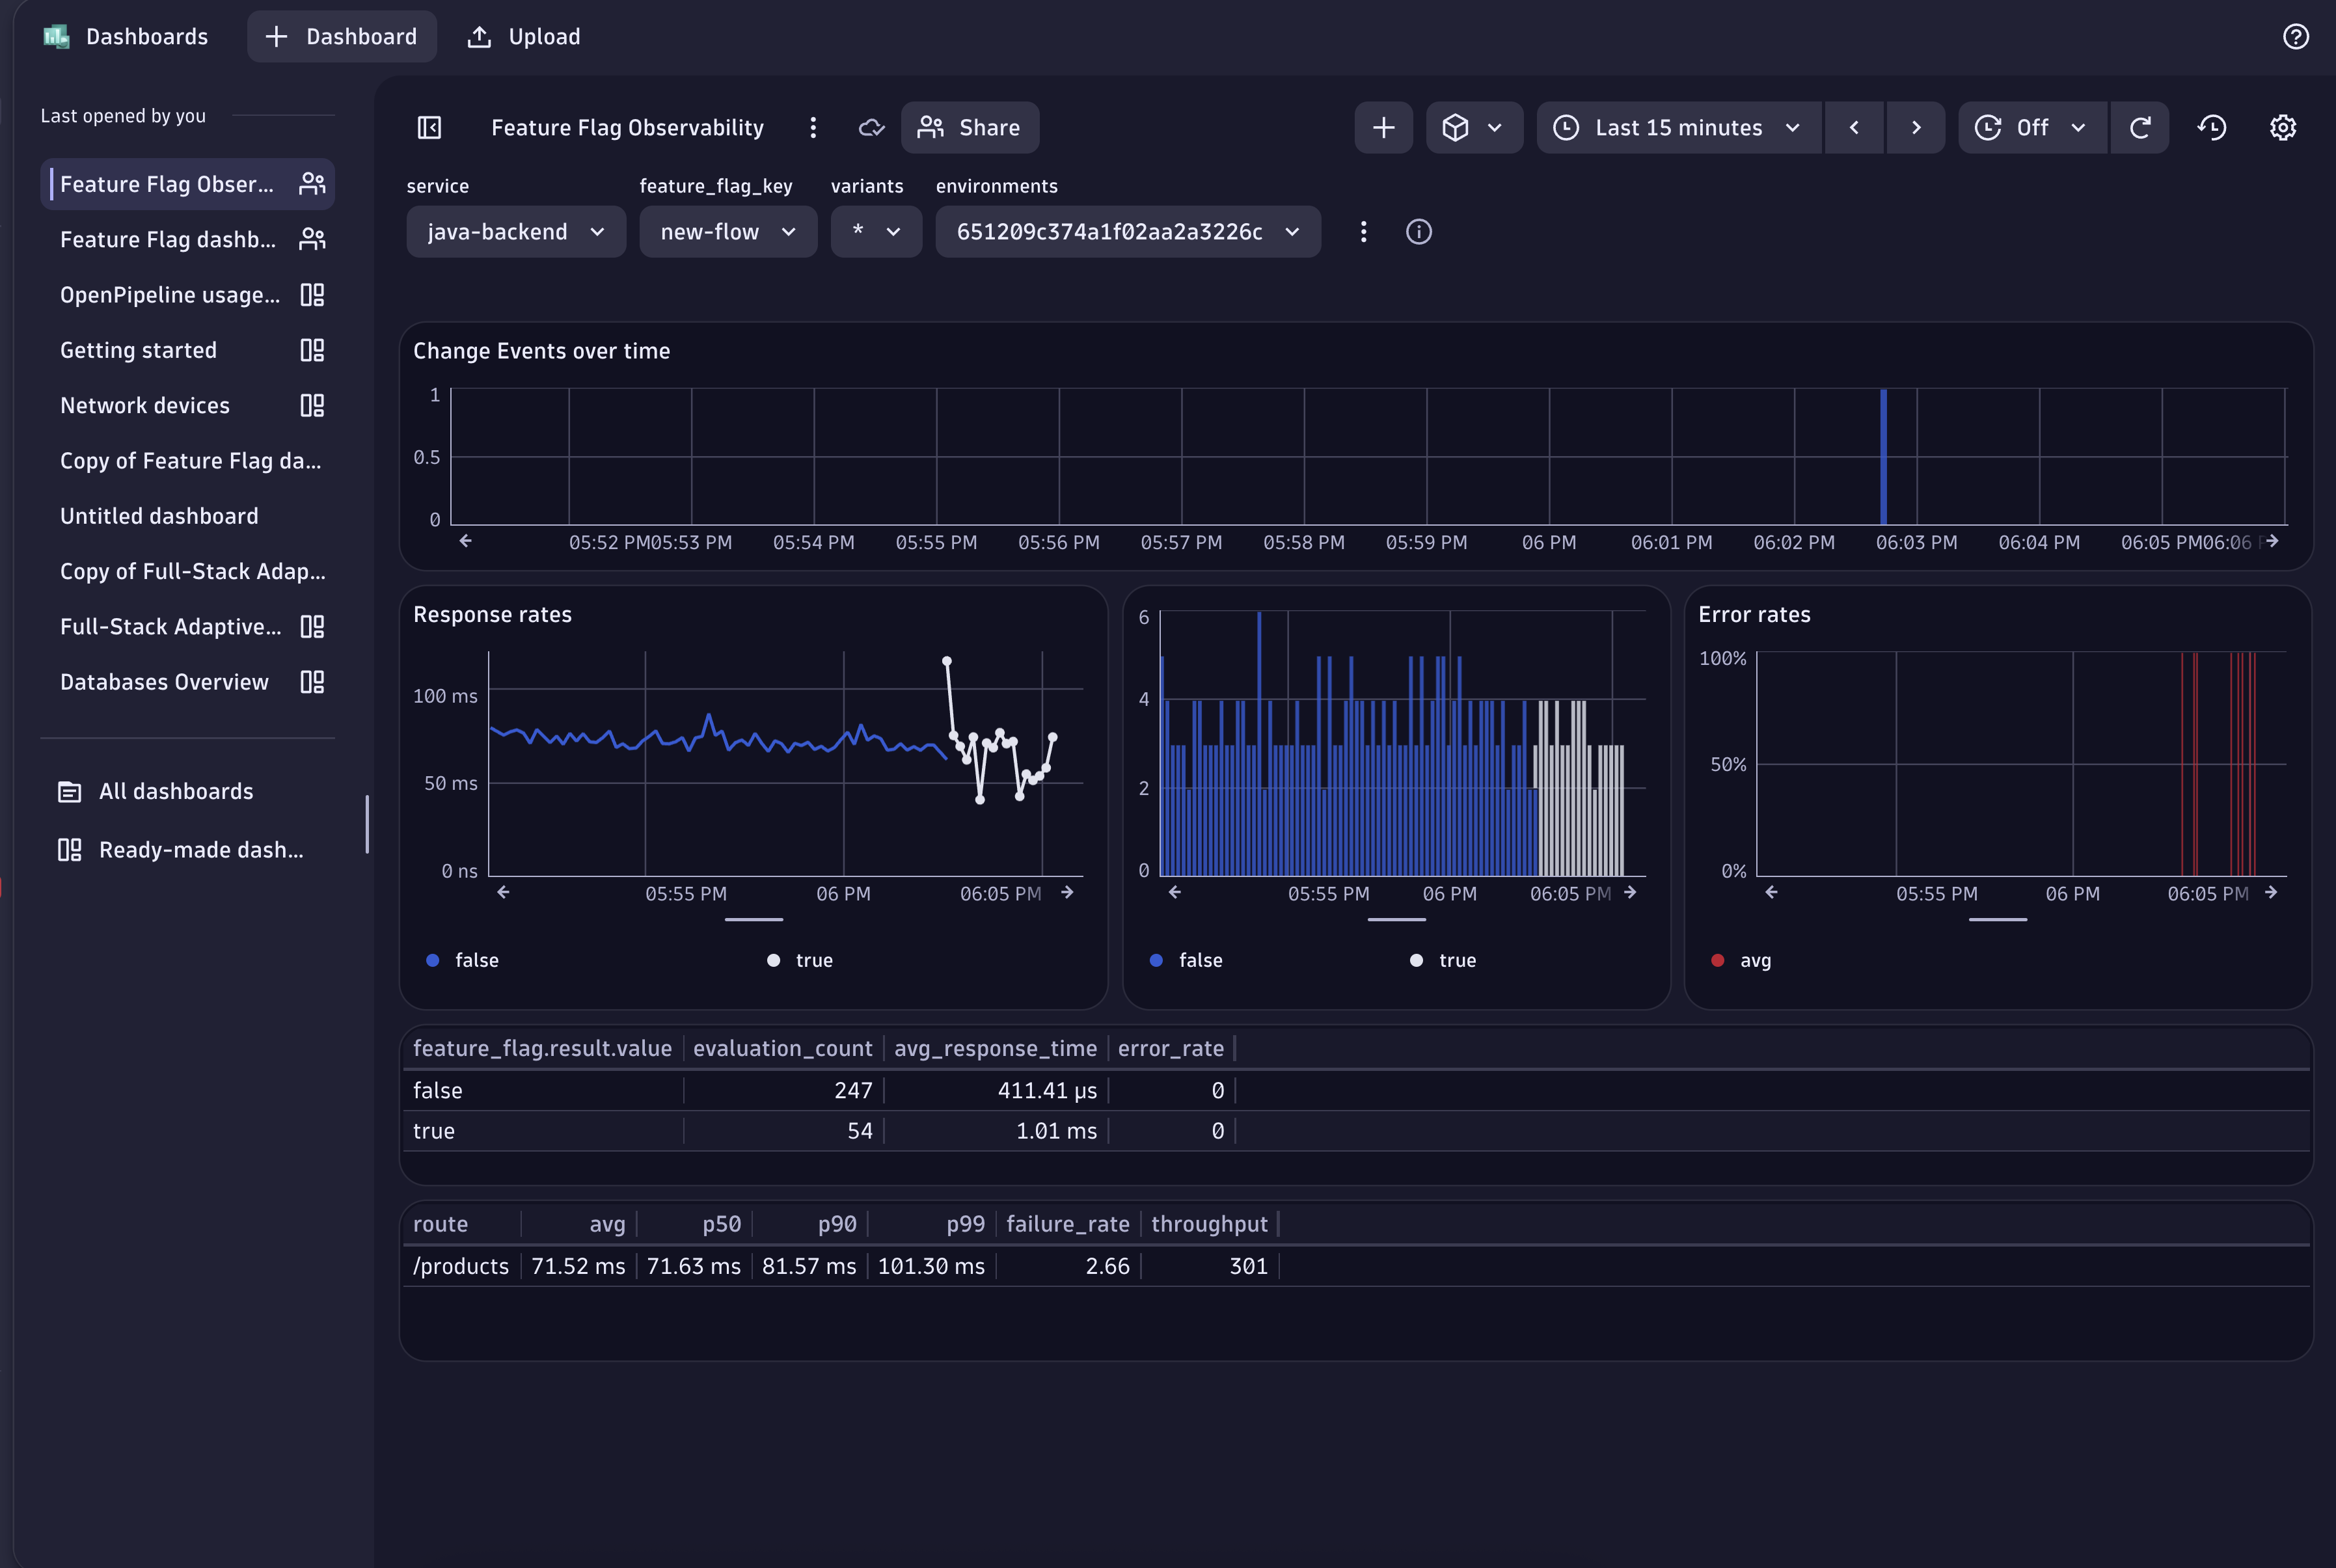
Workflows & Dashboard Setup in Dynatrace
We provide a Dynatrace workflow and dashboard to help visualize and investigate Feature Flag data.
- Workflow: Automatically creates a Feature Flag update event for services sending spans (no need to manually map services to Flags).
- Dashboard: Displays Flag state changes over time, including response rates, throughput, and error rates in regards to a specific Feature Flag for a service.
You will have to import the Workflow and Dashboard into your Dynatrace instance through the following steps.
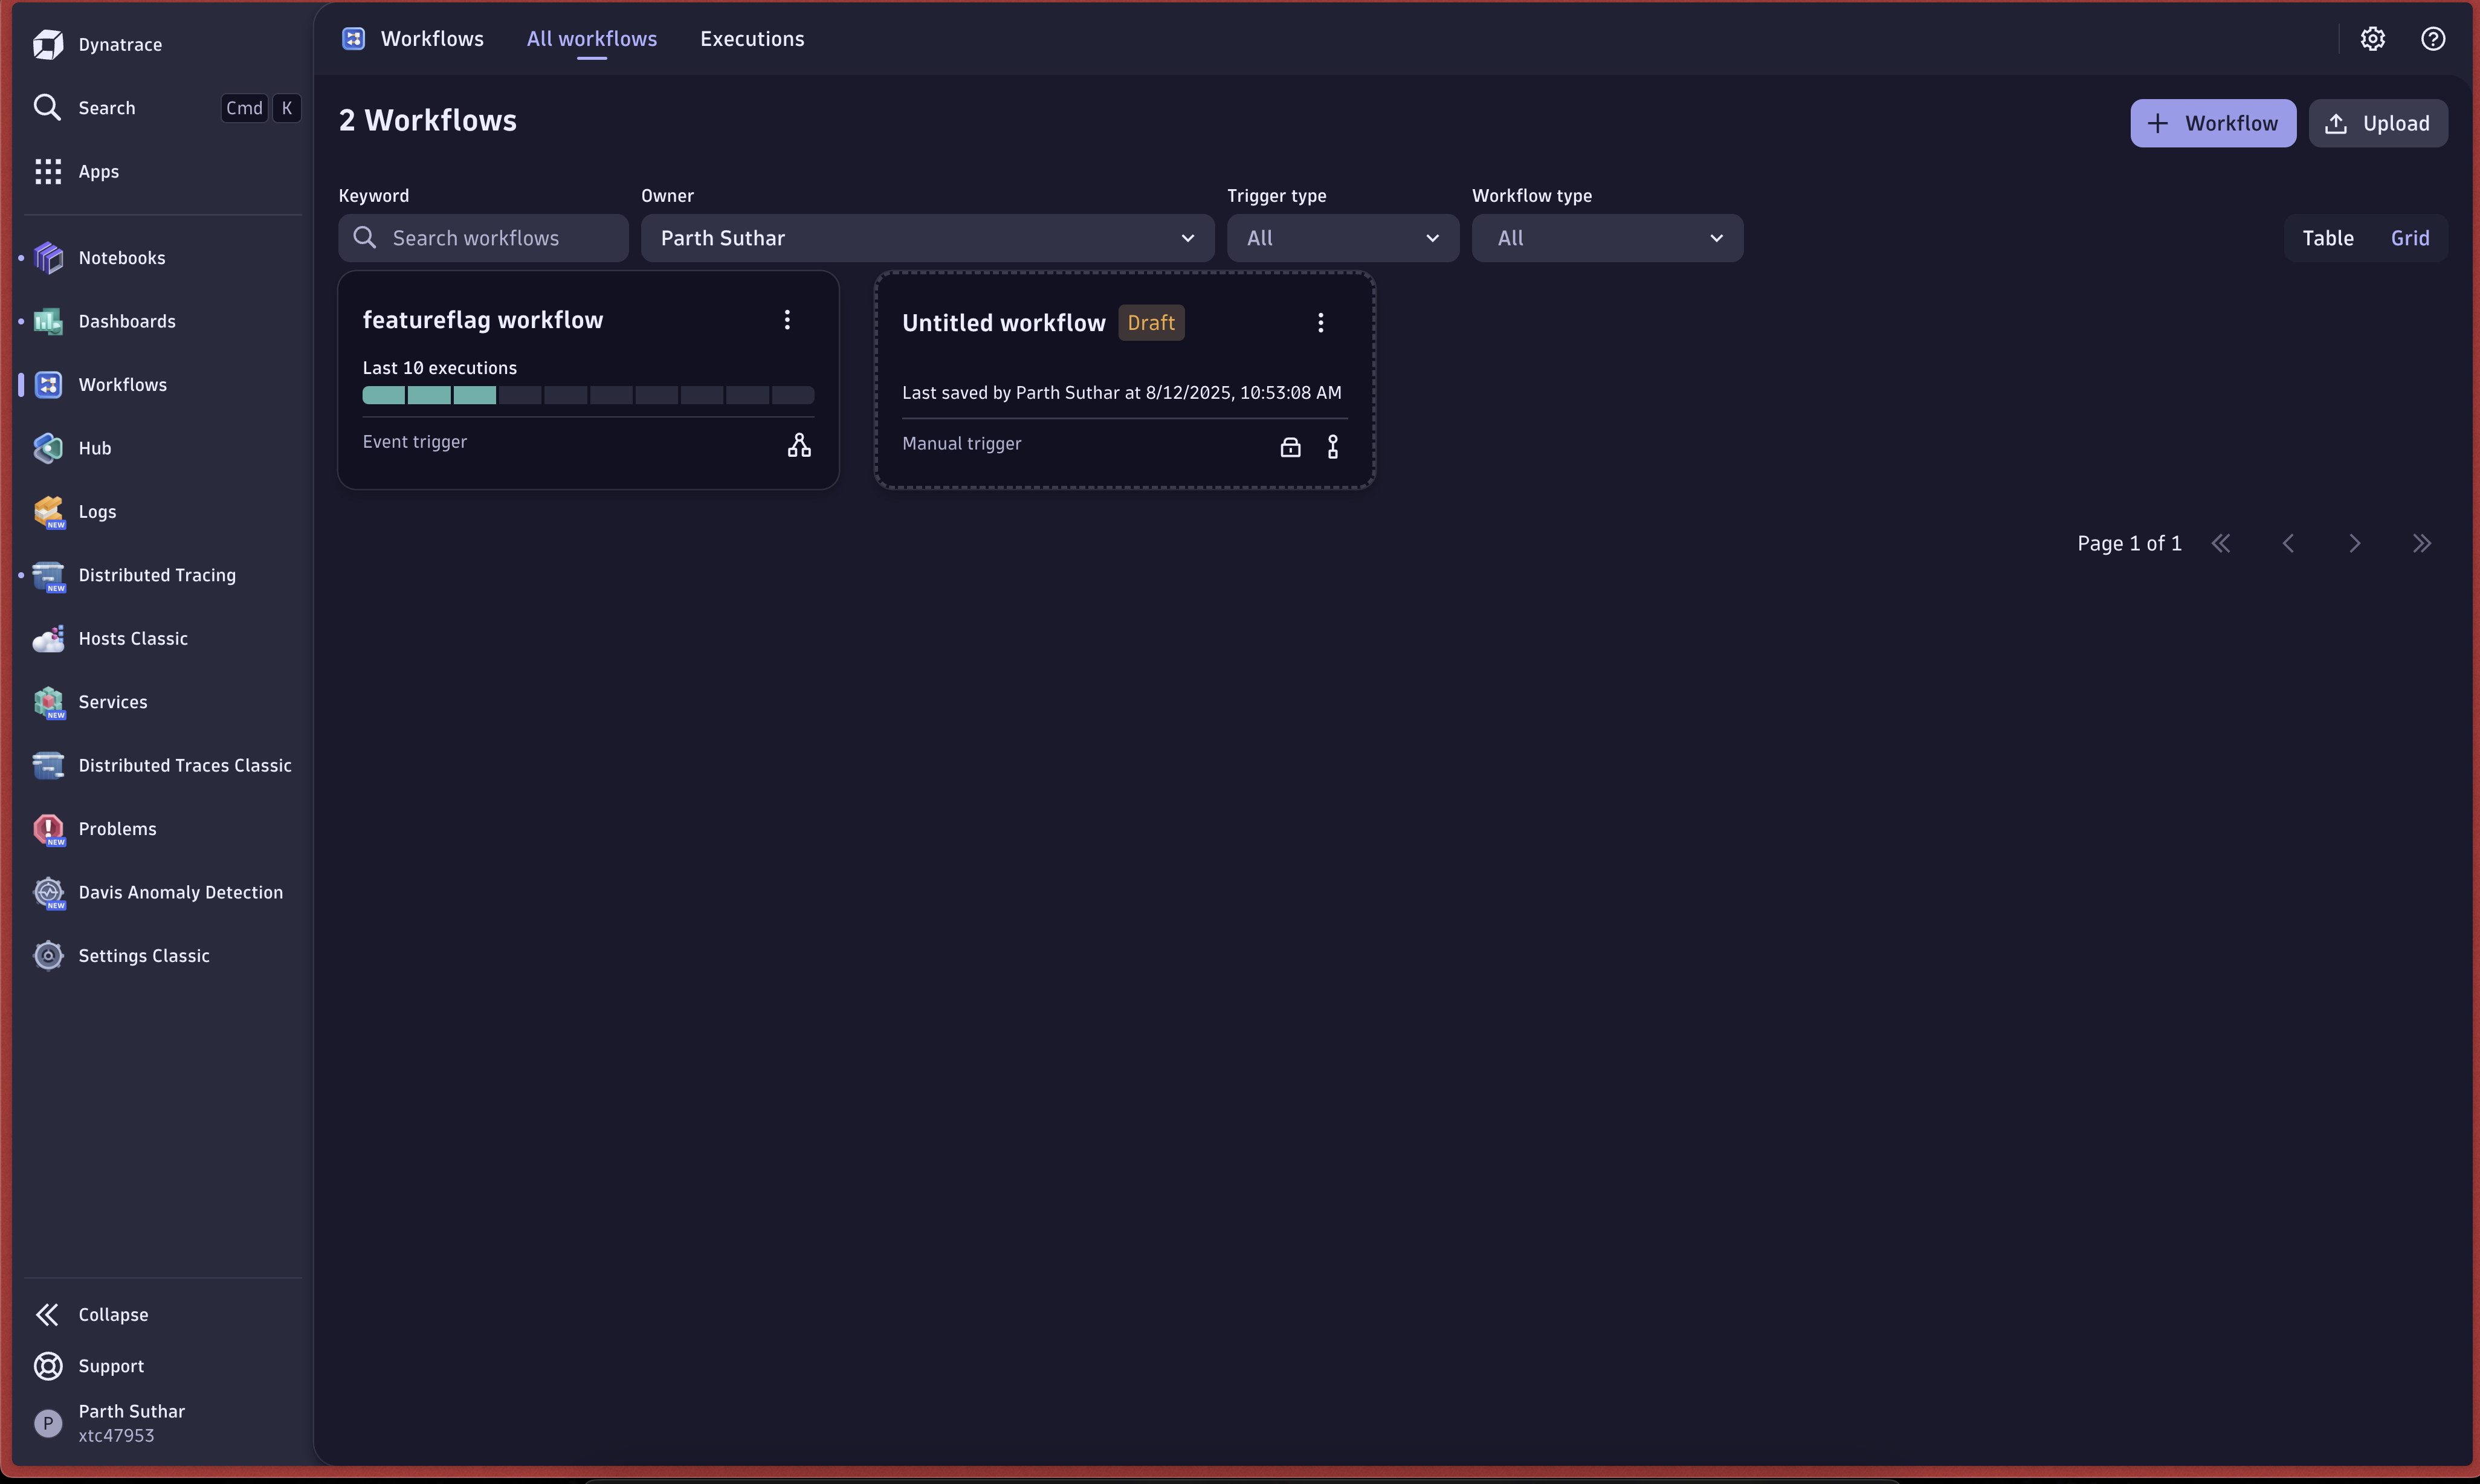
Import Workflow
- Download the workflow JSON: Workflows Feature Flag.json
- In Dynatrace, go to Workflows → Upload, and import the file.
Import Dashboard
- Download the dashboard JSON: Feature Flag Observability.json
- In Dynatrace, go to Dashboards → Upload, and import the file.