How things are calculated
DevCycle uses two methods to calculate metrics created to evaluate your experiments:
- Z-Score - is used for binary conversion Metrics i.e. Events / Unique User
- Two-Tailed T-Test - is used for value optimization Metrics where the comparison is the difference between two average values
Both of the above methods test for a 95% confidence level.
Below is a brief definition of the calculations used to determine the success of each type of Metric when viewing the Metric Results section on a DevCycle Feature:
Binary Conversion Metrics (Counts Per Denominator)
Type: Count per Variable Evaluation
This type counts the total number of times this event has been seen ONLY when the actual related variable has been evaluated. This is a very useful case, as there may be events which already exist within your system which could potentially also be impacted by this variable. In this case, this type of Metric represents the exact number of times that event has been sent ONLY after the related variable has since been evaluated for use.
Type: Count per Unique User
This Metric type calculates the total number of times a unique user (or service) has sent this event. This can be something such as total number of clicks on a new feature, total number of API calls for a new service, total number of of views for a new advertisement, etc. This is also useful for error tracking -- A total count of specific errors is a great Metric to count when monitoring the rollout of a new release of a feature.
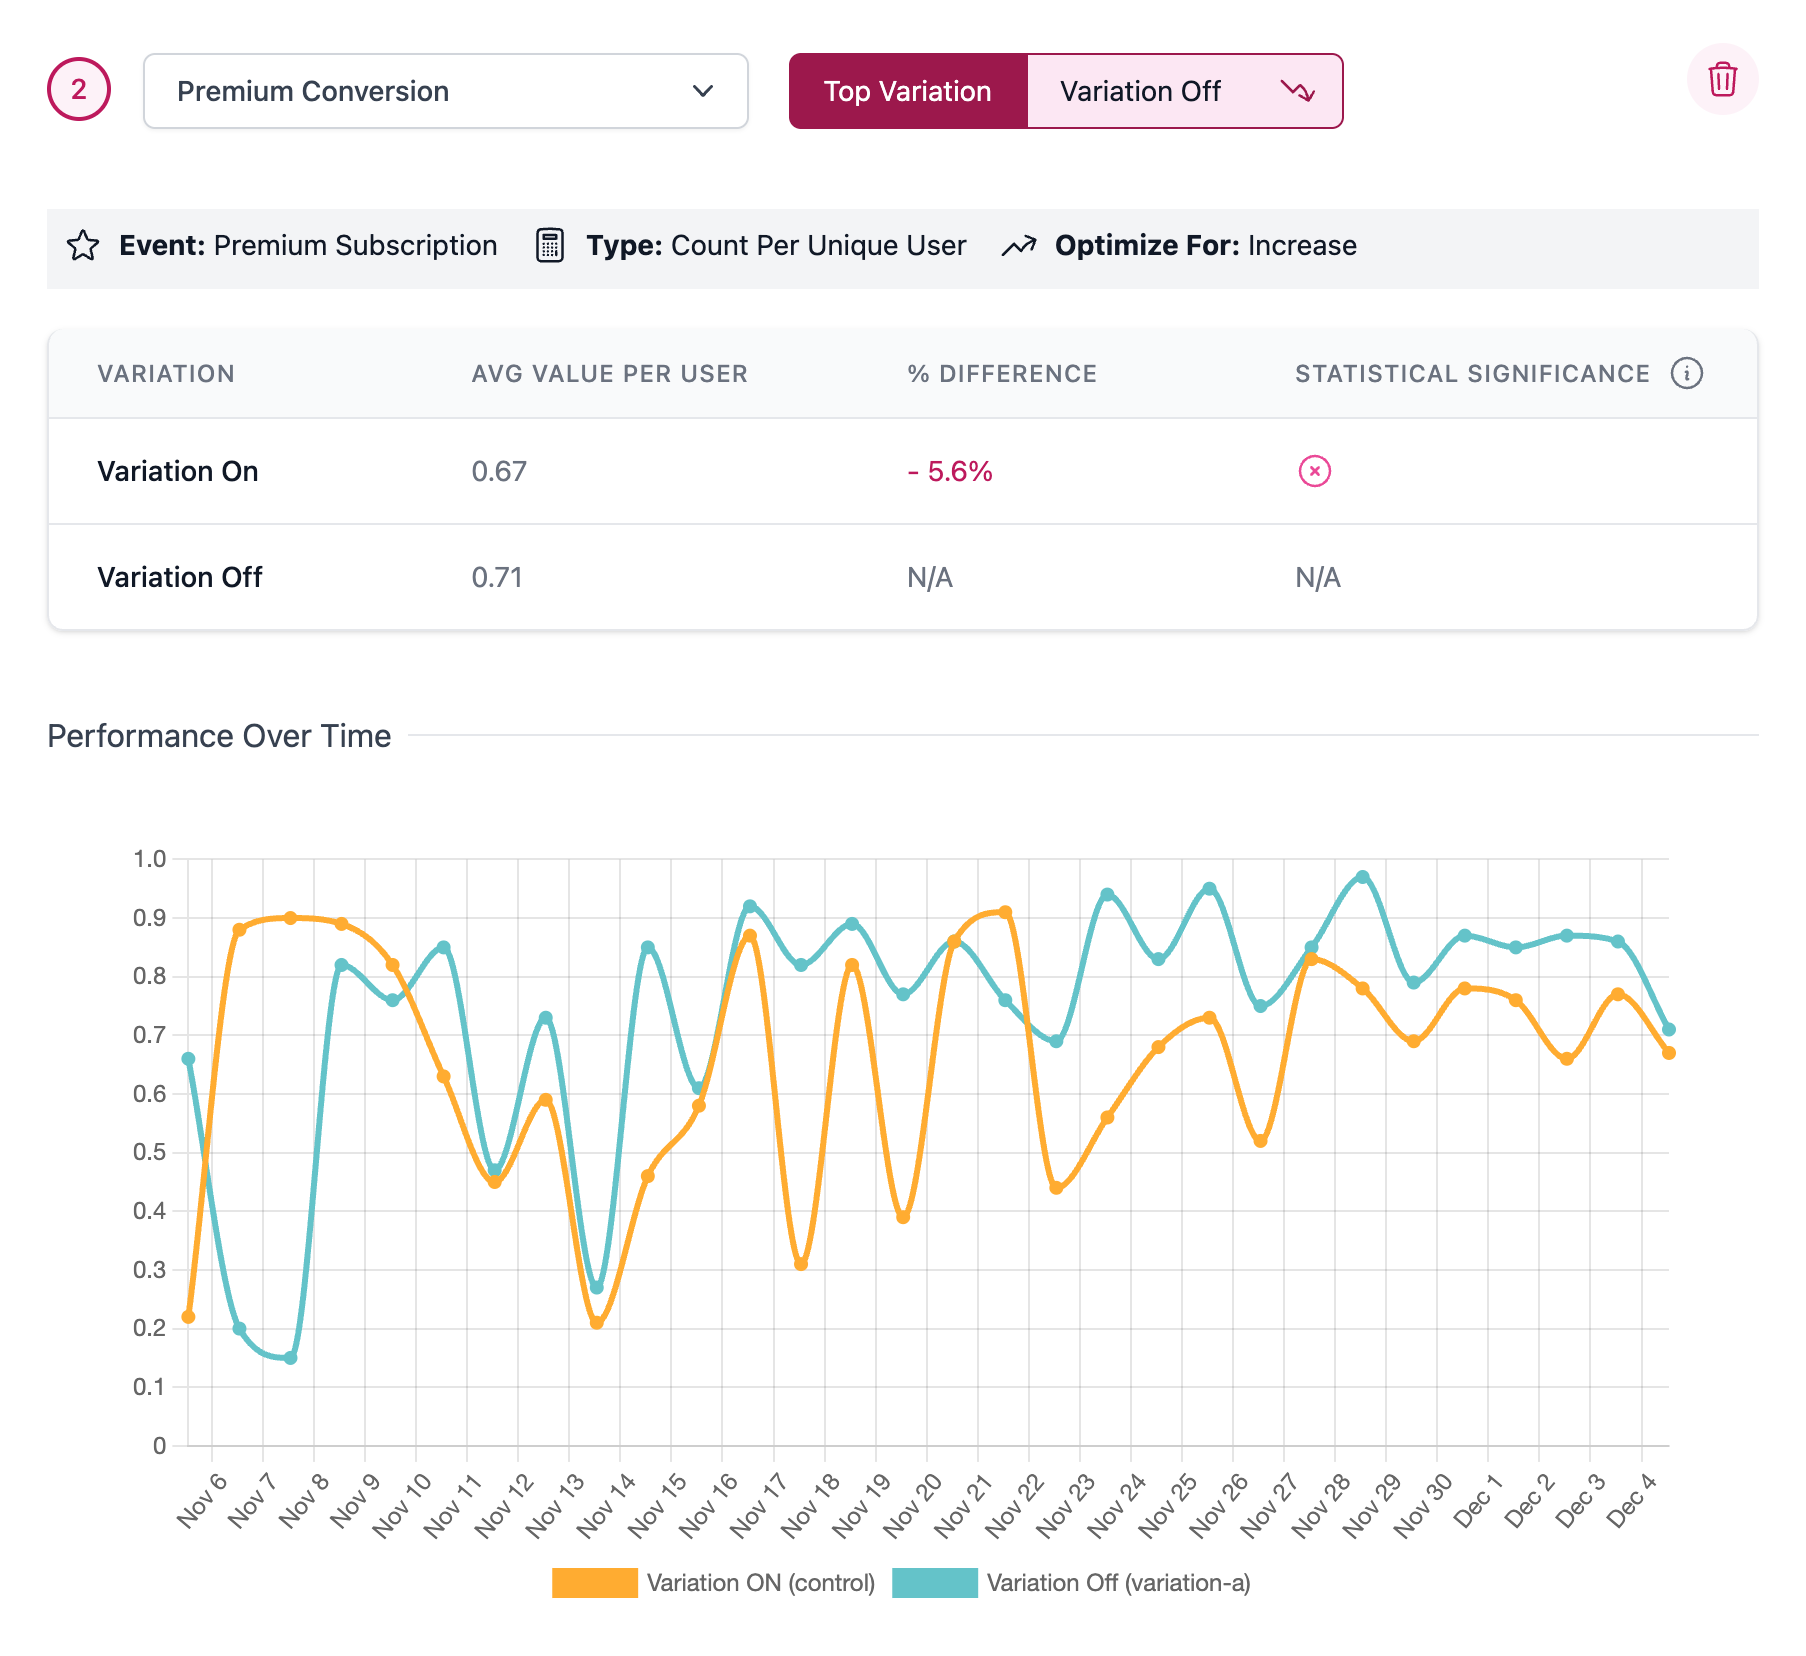
Explanation of Columns
Variation - The name of the variation for the feature. Each event sent by DevCycle will contain a set of Features and Variations a user is in at that time, which will ultimately influence the entire calculation.
Events/Denominator = This is a straight calculation of the number of events divided by the denominator chosen for the metric.
% Rate - This is calculated in the following way:
(Conversion Rate Variation - Conversion Rate Control) / Control Rate
% Difference - This is a simple calculation of the difference between the Events/Denominator of the variation and the Control variation.
Statistical Significance - An icon that indicates whether the Feature has reached statistical significance or not at a 95% confidence interval.
Value Optimization Metrics (Numerical Metrics)
Type: Sum per User
Each event can carry a numerical value with it, and this Metric will sum up the total number sent with the events per unique user. This type of Metric is great for tracking things such as Revenue, or number of total items purchased or interacted with. From an engineering view, things such as a total number of api calls per unique user may be something intended to decrease (for optimizations) or increase (for increased interaction).
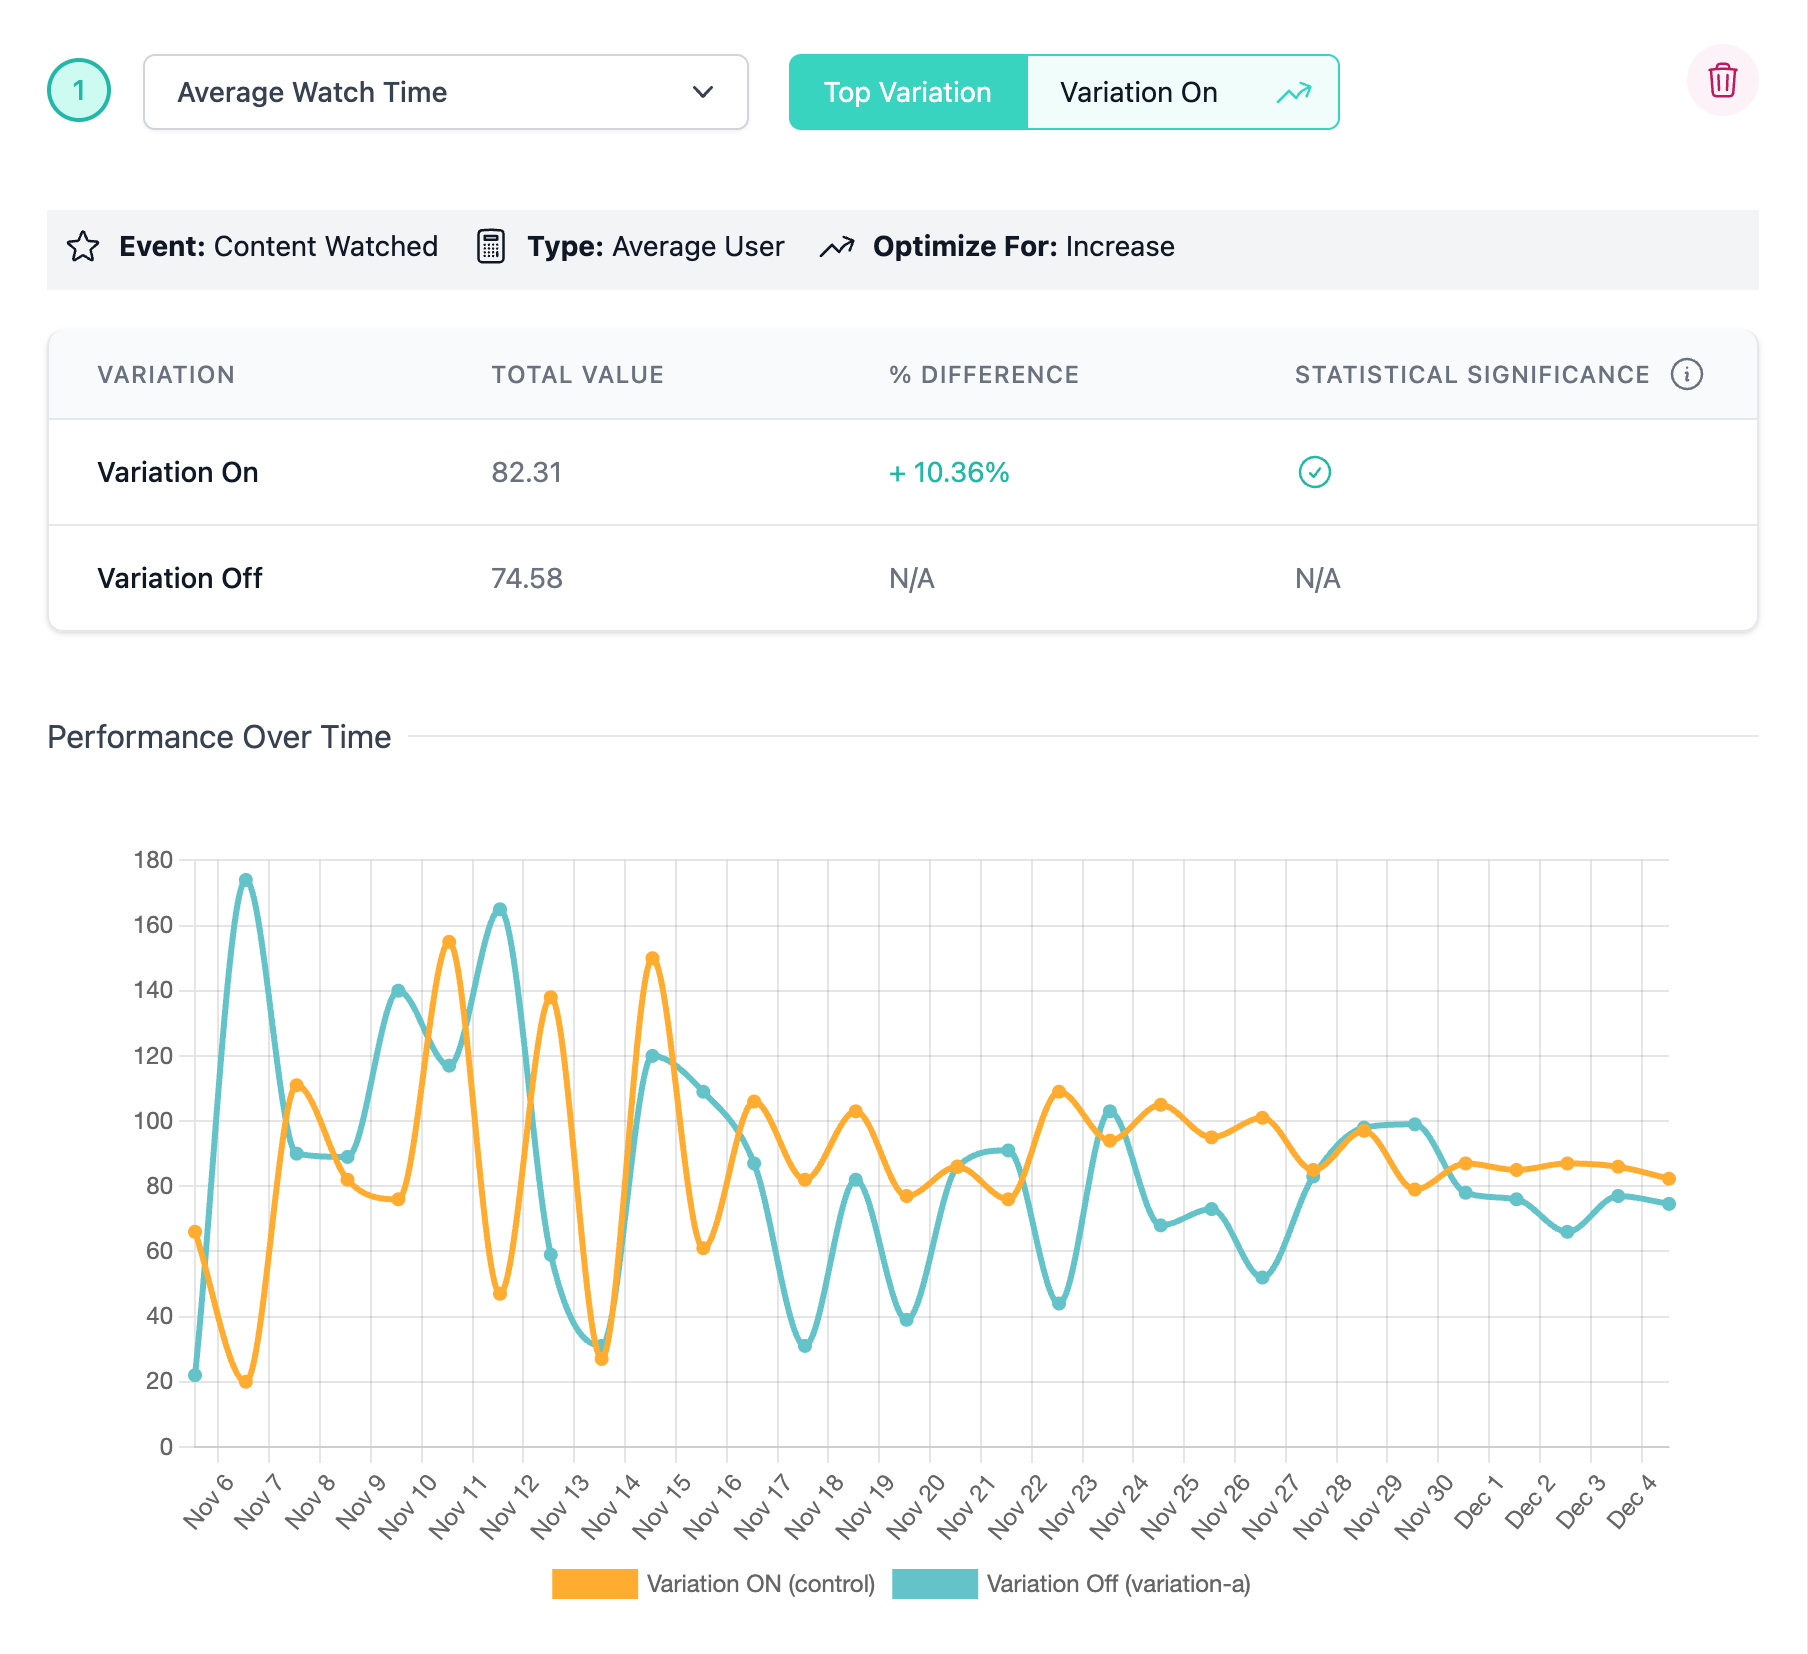
Type: Average per User
Similar to the sum per user, the average for user also uses the numerical value on each event. This type of Metric is extremely useful for tracking things such as the average latency per API call, or average size of an API call, hoping for a decrease. Load times, server load, api latency, or even your own internal build time can be candidates for a Metric which is re-used across every single feature for viewing the impact and reacting accordingly.
Explanation of Columns
Variation - The name of the variation for the feature. Each event sent by DevCycle will contain a set of Features and Variations a user is in at that time, which will ultimately influence the entire calculation.
Average Value per User - Is the calculated mean of the user event averages.
% Difference - Simple difference check against the Control value.
Statistical Significance - An icon that indicates whether the Feature has reached statistical significance or not at a 95% confidence interval.