Creating and Managing Metrics
Metrics are available to all customers on any plan and rely on Custom Events that must be sent to DevCycle. All plans come with an included amount of free events. When exceeded, additional costs will be incurred. To learn more, read about our pricing, or contact us.
This article explains how to create, define, and manage all of the Metrics in a Project.
Metrics provide a broad overview of your system. They may be used to quickly assess the health of your Features across environments, visualize how quickly people are visiting your applications, or how much memory is being used by your servers as a Feature rolls out. Metrics may be known as "Goals" on other platforms.
Within DevCycle, Metrics are their own items outside of a Feature and thus can be defined once and applied to as many Features as desired. This gives the opportunity to attach and test Metrics with seemingly unrelated Features and find unintended or hidden impacts.
Metrics Section
To view and create Metrics, first navigate to the Metrics section of the Dashboard
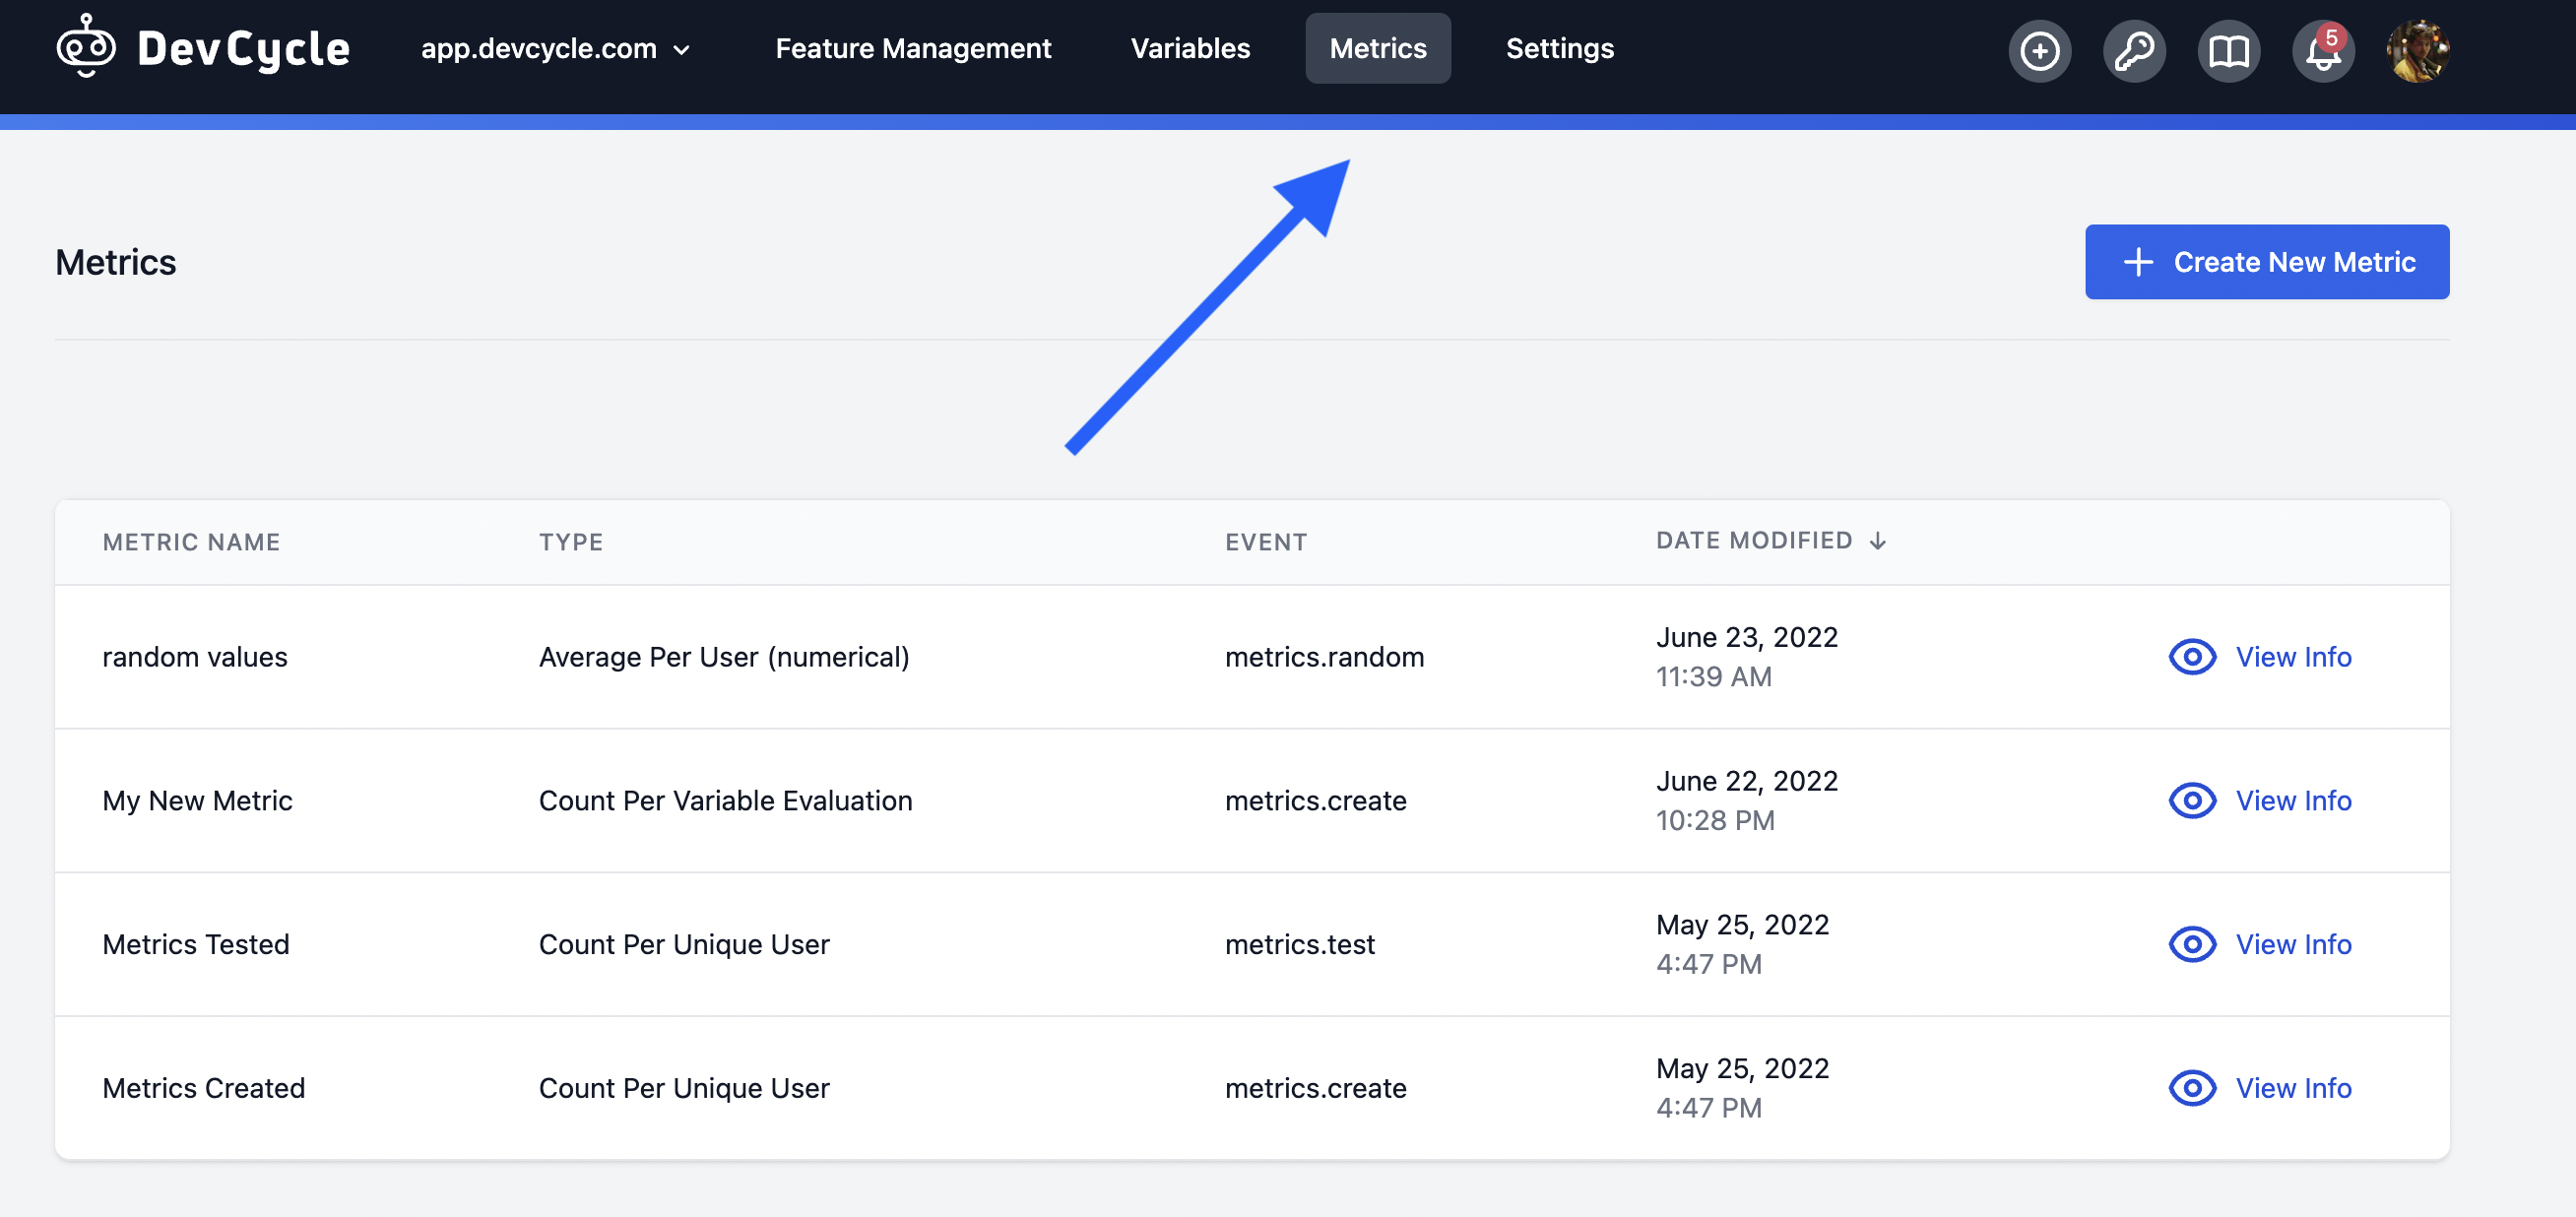
This section will contain a list of all of the Metrics on the current Project, all of which are re-usable across any number of Features at any time. This list contains some simple base info.
Below is a brief description of each column, with deeper explanations later in this document
- Name - The name of the Metric. This name is the human-readable format of the Metric for easily discussing the Metrics. As explained later, the
keyis what will be used within the Management API. - Type - The "Type" of Metric which represents the dimension or calculation used for the Metric. It may be a simple count, or a rate, or an average. These type definitions are described below in "Creating a Metric".
- Event Type - This is the name of the event sent by the SDKs or APIs which is being used for this Metric.
- Date Modified - Simple date explaining the last time someone made any modifications to a Metric which may have changed anything significant to the calculated results.
Creating a Metric
Follow the video below from our DevCycle Experiment Setup series or read-along to find out how to create a Metric on DevCycle.
To create a Metric, navigate to the Metrics page as noted above, and click "Create a Metric".
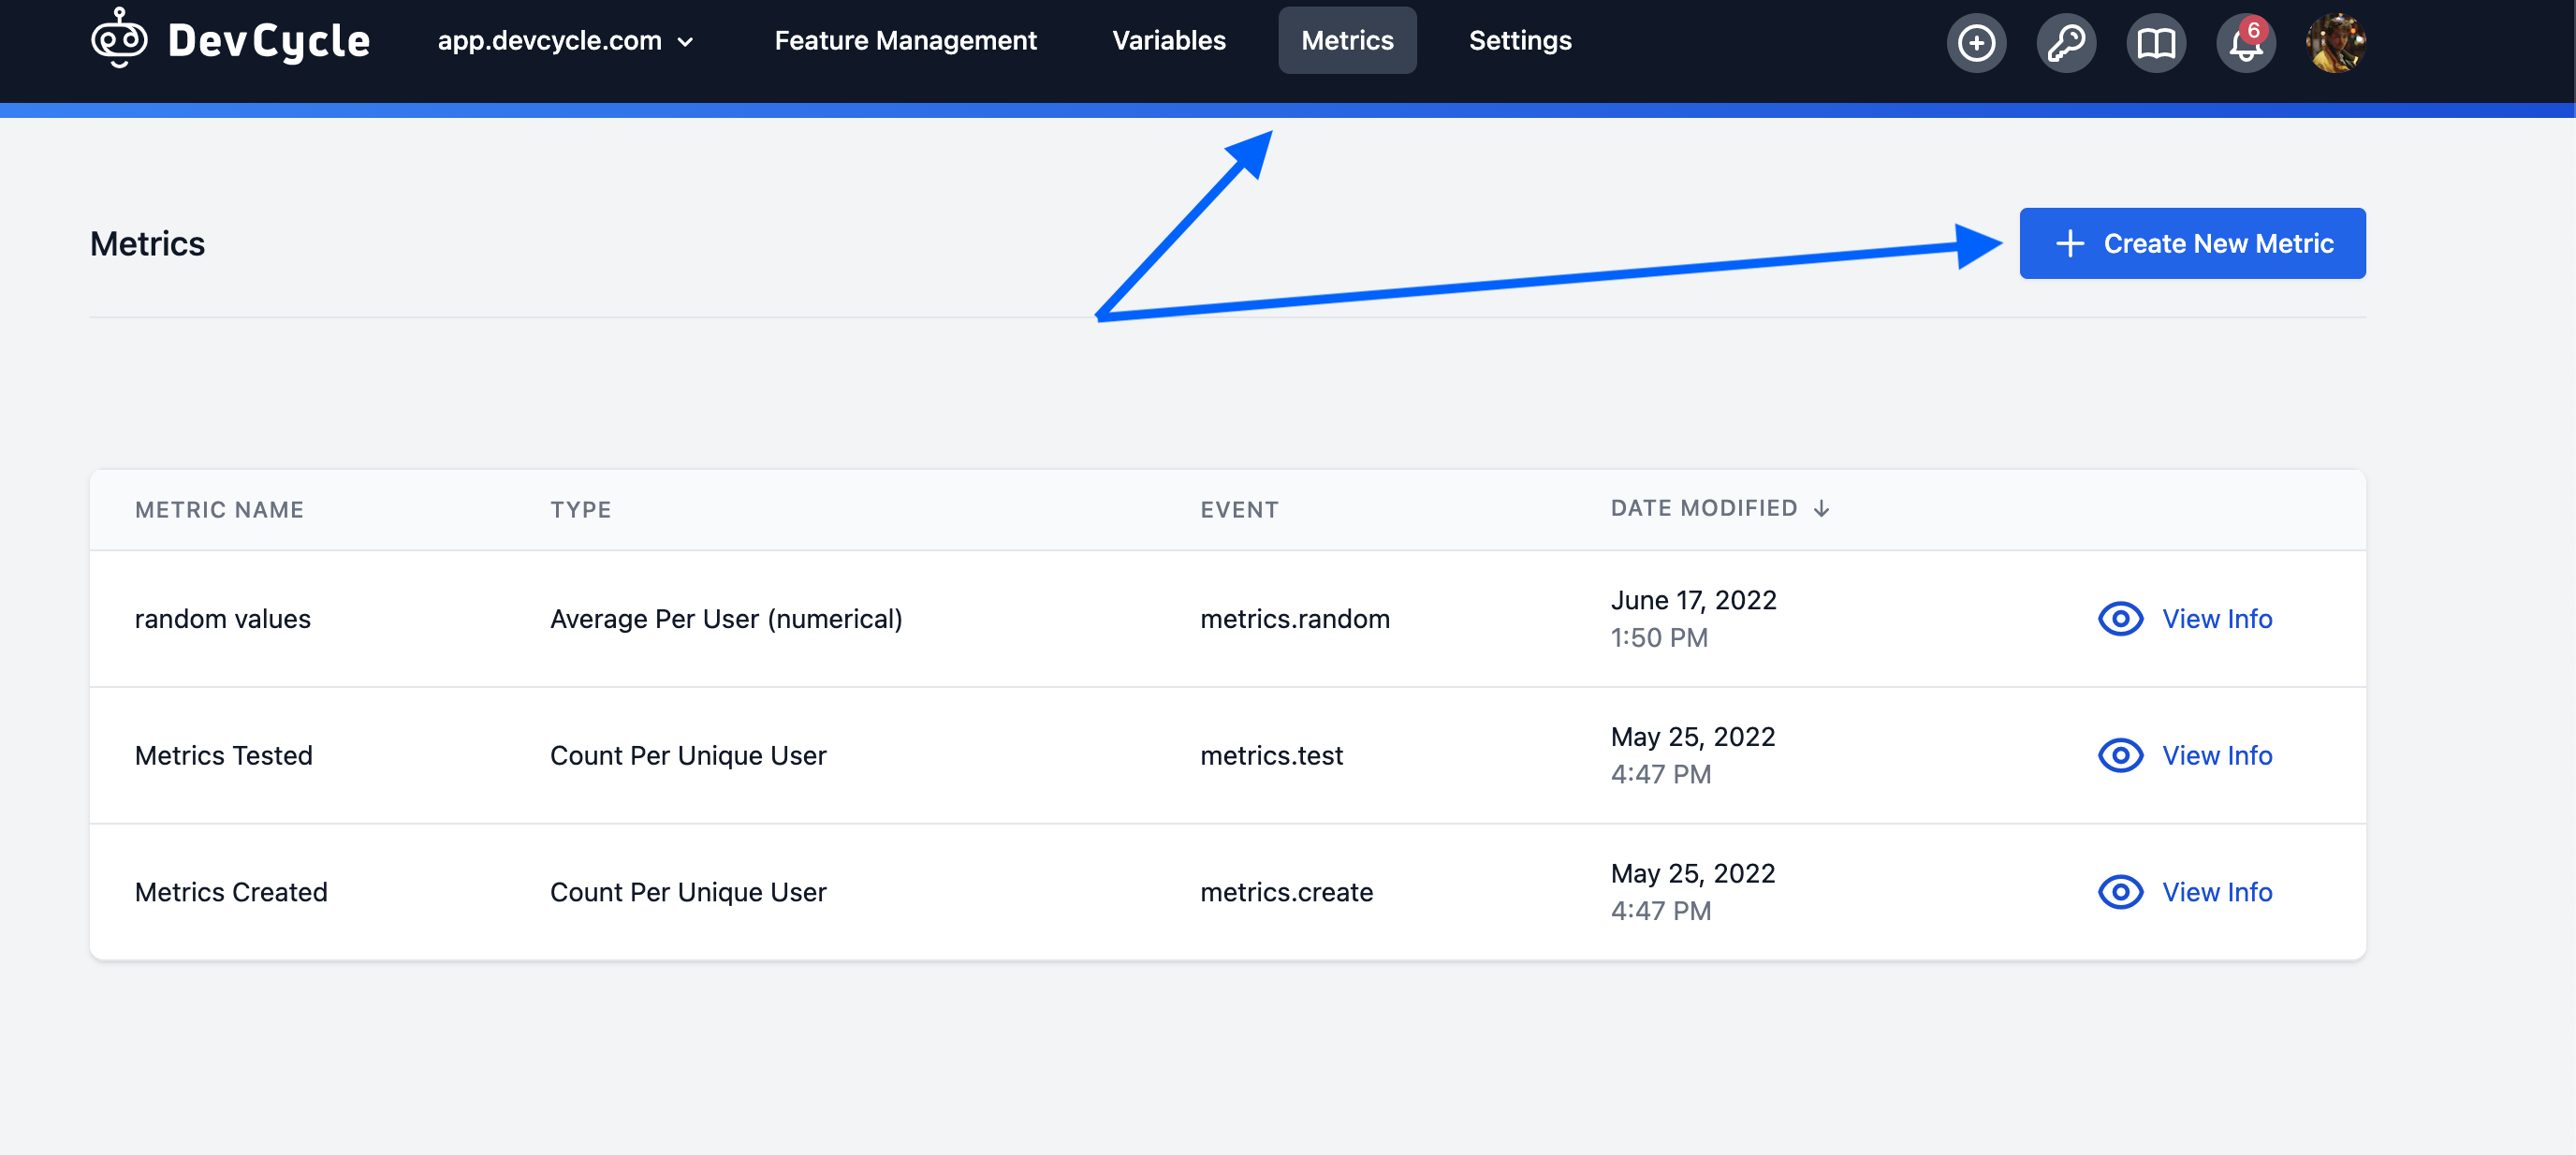
Metrics can also be created directly within any Feature from the Experimentation panel.
Upon clicking create, the following modal will show:
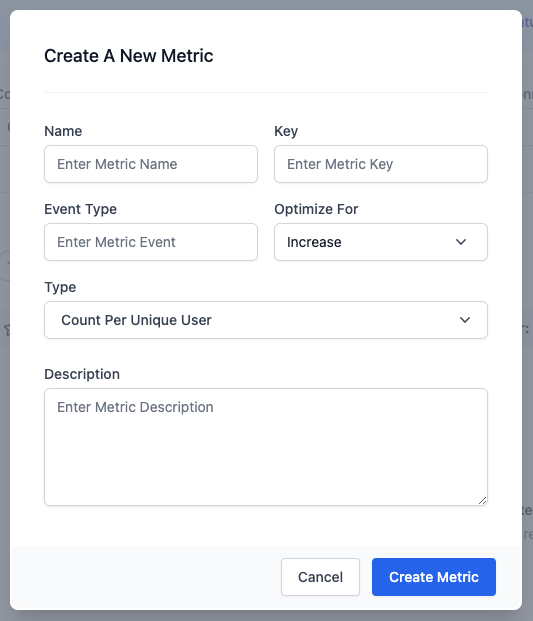
To set up a Metric, the following items are needed:
-
Name - This is the name of the Metric. It should be descriptive enough that any team member viewing it understands it and can both get the information necessary, and also decide if they would like to re-use the Metric for other Features.
-
Key - Like other DevCycle keys, this is how this Metric will be referenced in the Management API and all other non-dashboard interactions with this Metric.
-
Event Type - This is the EXACT event name that is sent by the DevCycle Track methods of the SDKs or via the DevCycle APIs. This event will be used in all calculations of the Metric. How it is used specifically is described below in How do Metrics get calculated?
-
Optimize For - DevCycle represents Metrics as a positive or negative depending on the desired optimization. Often times, tools will always assume that an increase is beneficial. However, in most engineering applications, the opposite is true! Things such as latency, load times, server load, and processing times are Metrics that should be decreased. DevCycle will make obvious whether a Metric is improving in the desired direction, and will soon notify you if a significant impact in either direction has been made.
-
Description (optional) - A meaningful description explaining what this Metric is for and why it is being tracked. In conjunction with DevCycle's Jira Integration, this can be useful for managers to get a greater depth of information when understanding Metrics.
-
Type - The type of a Metric defines how and what it is calculating and represented to the user. This "Type" is currently a set of the items defined below and available in the dropdown.
Types
When making a Metric, the types of Metrics will contain a small definition
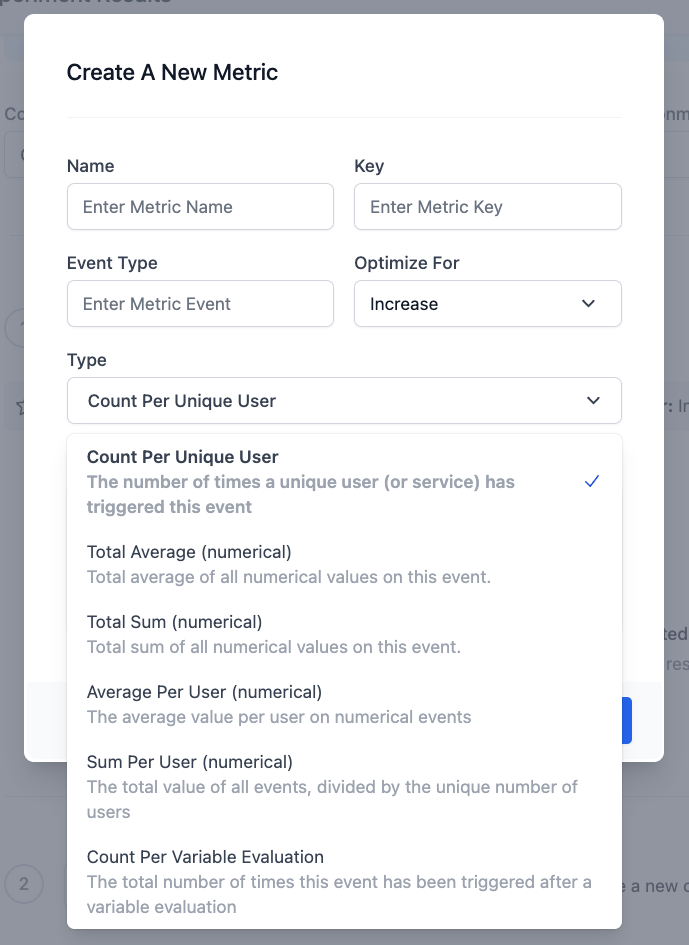
Count per Unique User - This Metric type calculates the total number of times a unique user (or service) has sent this event. This can be something such as total number of clicks on a new feature, total number of API calls for a new service, total number of of views for a new advertisement, etc. This is also useful for error tracking -- A total count of specific errors is a great Metric to count when monitoring the rollout of a new release of a Feature.
Count per Variable Evaluation - This type counts the total number of times this event has been seen ONLY when the actual related Variable has been evaluated. This is a very useful case, as there may be events which already exist within your system which could potentially also be impacted by this Variable. In this case, this type of Metric represents the exact number of times that event has been sent ONLY after the related Variable has since been evaluated for use.
Sum per User (numerical) - Each event can carry a numerical value with it, and this Metric will sum up the total number sent with the events per unique user. This type of Metric is great for tracking things such as Revenue, or number of total items purchased or interacted with. From an engineering view, things such as a total number of api calls per unique user may be something intended to decrease (for optimizations) or increase (for increased interaction).
Average per User (numerical) - Similar to the sum per user, the average for user also uses the numerical value on each event. This type of Metric is extremely useful for tracking things such as the average latency per API call, or average size of an API call, hoping for a decrease. Load times, server load, api latency, or even your own internal build time can be candidates for a Metric which is re-used across every single Feature for viewing the impact and reacting accordingly.
Future Types - If there are any types of Metric you'd like to see, or if your team would like a more flexible view into all of your data, do not hesitate to reach out to [email protected]. We will be increasing the number of types, as well as providing direct calculation control in the future. If such things are desired now, contact us to discuss direct data access, which will provide full access to all events and data for each of your Projects.
Metric Details Page
After creating a Metric, or by clicking on one from the Metric list, you will be navigated to the Metric Details page. This page has the following sections.
Metric Definition
The Metric definition allows for modifying the Metric Name, Type, Definition, and Optimization.
Metric Testing
This section provides the ability to test a Metric against any Feature in any environment and ensure it is working as intended.
It is also useful to use this testing section to quickly check a Metric against any given Feature to potentially find any unintended impacts if the Metric is not associated with a specific Feature.
When testing a Metric, navigate to the Testing section.
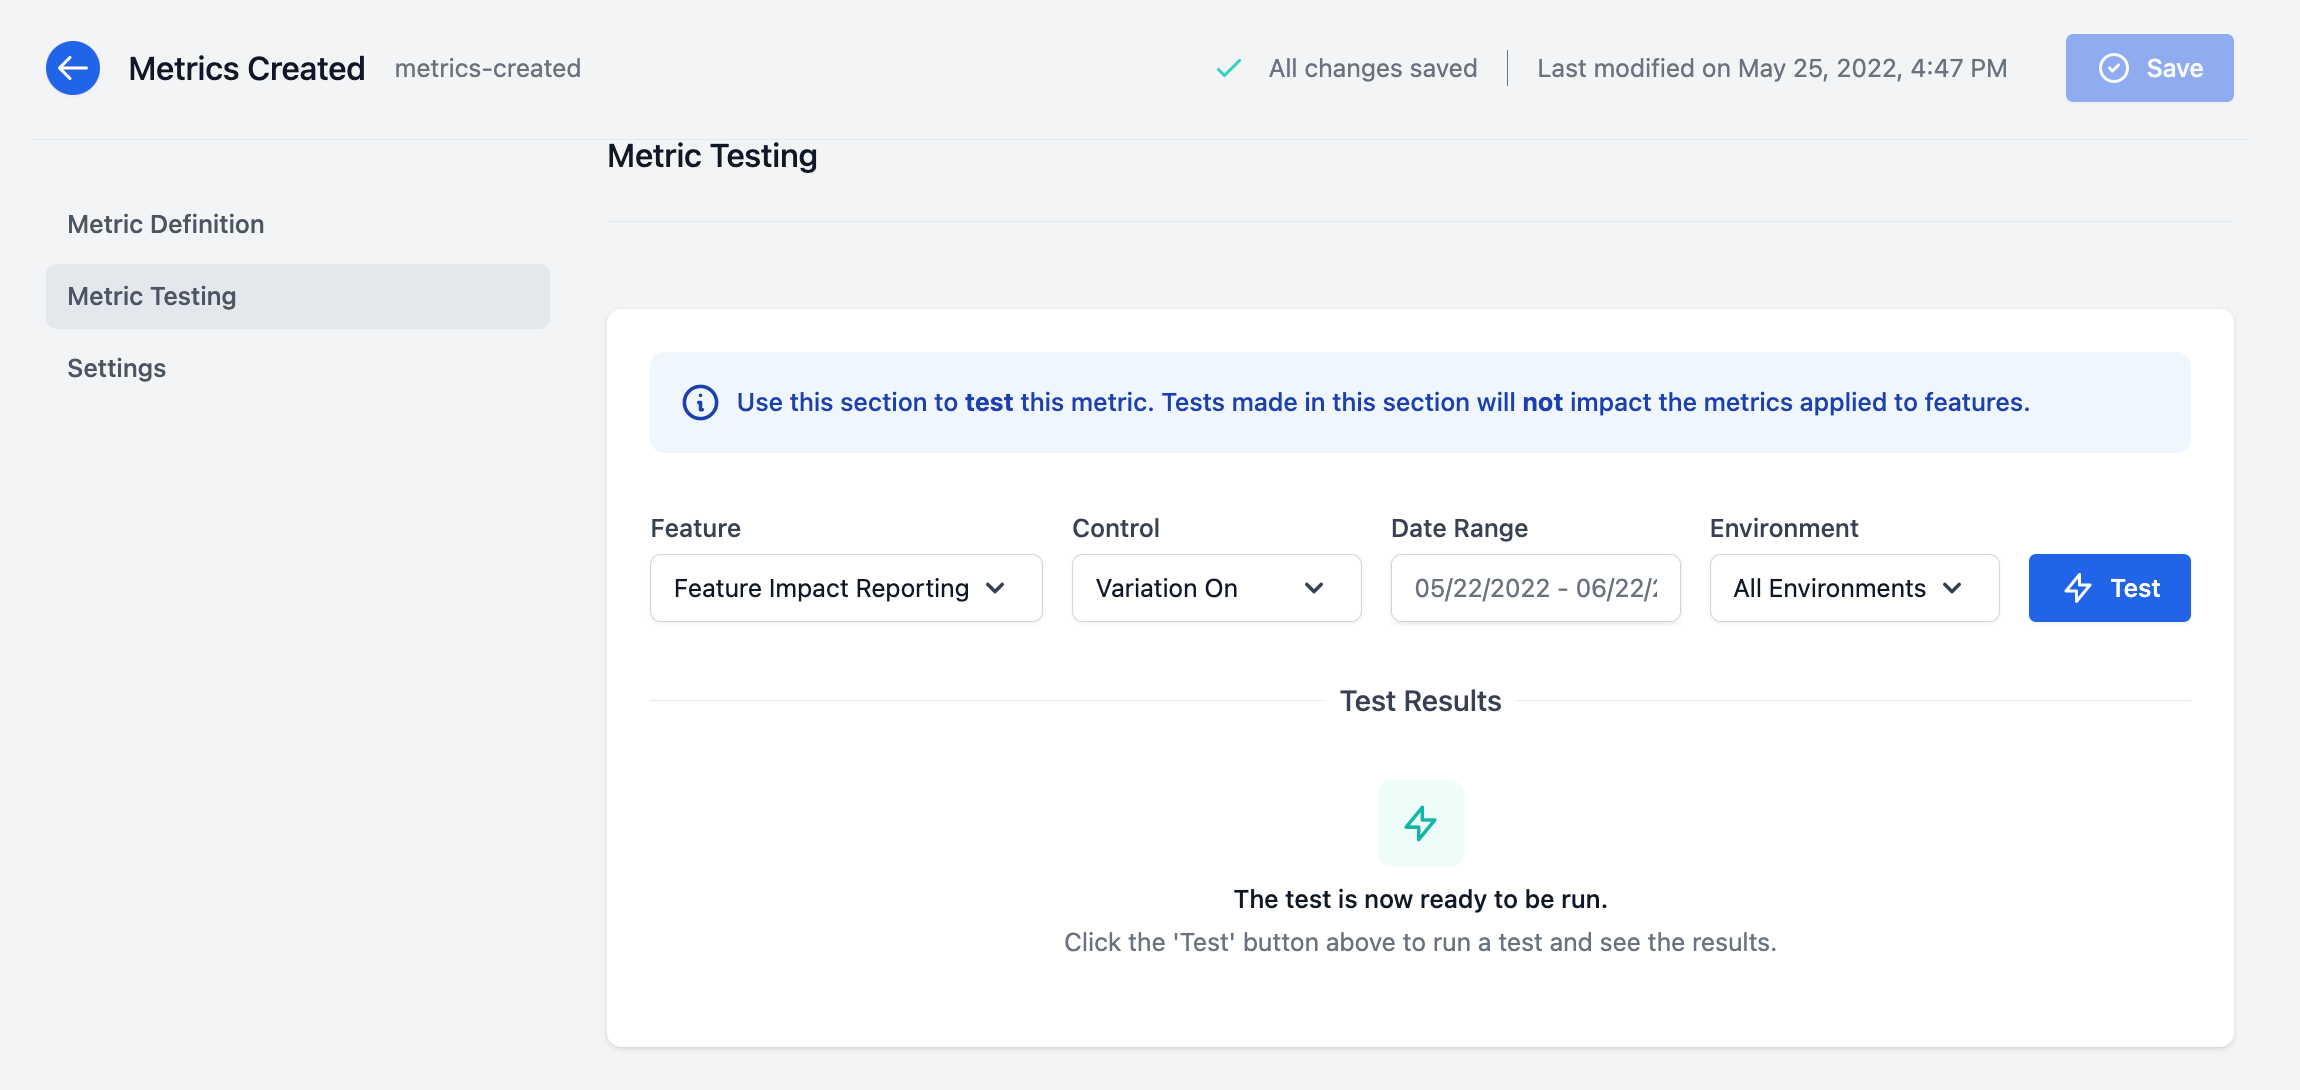
To run a test, the following fields must be set:
Feature - This is the specific Feature this Metric should be applied to. Any event that has been sent since the creation of this Metric from a user receiving any Variation of this Feature will be part of this Metric. In the event that an error is shown, this means the event has not been seen from this Feature yet.
Control - After selecting a Feature, a "control" Variation must be selected. This is what will be used to show a comparative analysis against all other Variations in a Feature. Typically, an "off" or "Baseline" Variation would act as the control. For more information on this, please refer to the Feature Experimentation documentation.
Date Range - Select a date range of up to the last 30 days to display results for. This range will default to the last 30 days or to the Feature creation date if the Feature was created within 30 days.
Environment - This will calculate the Metric using events from the specified environments.
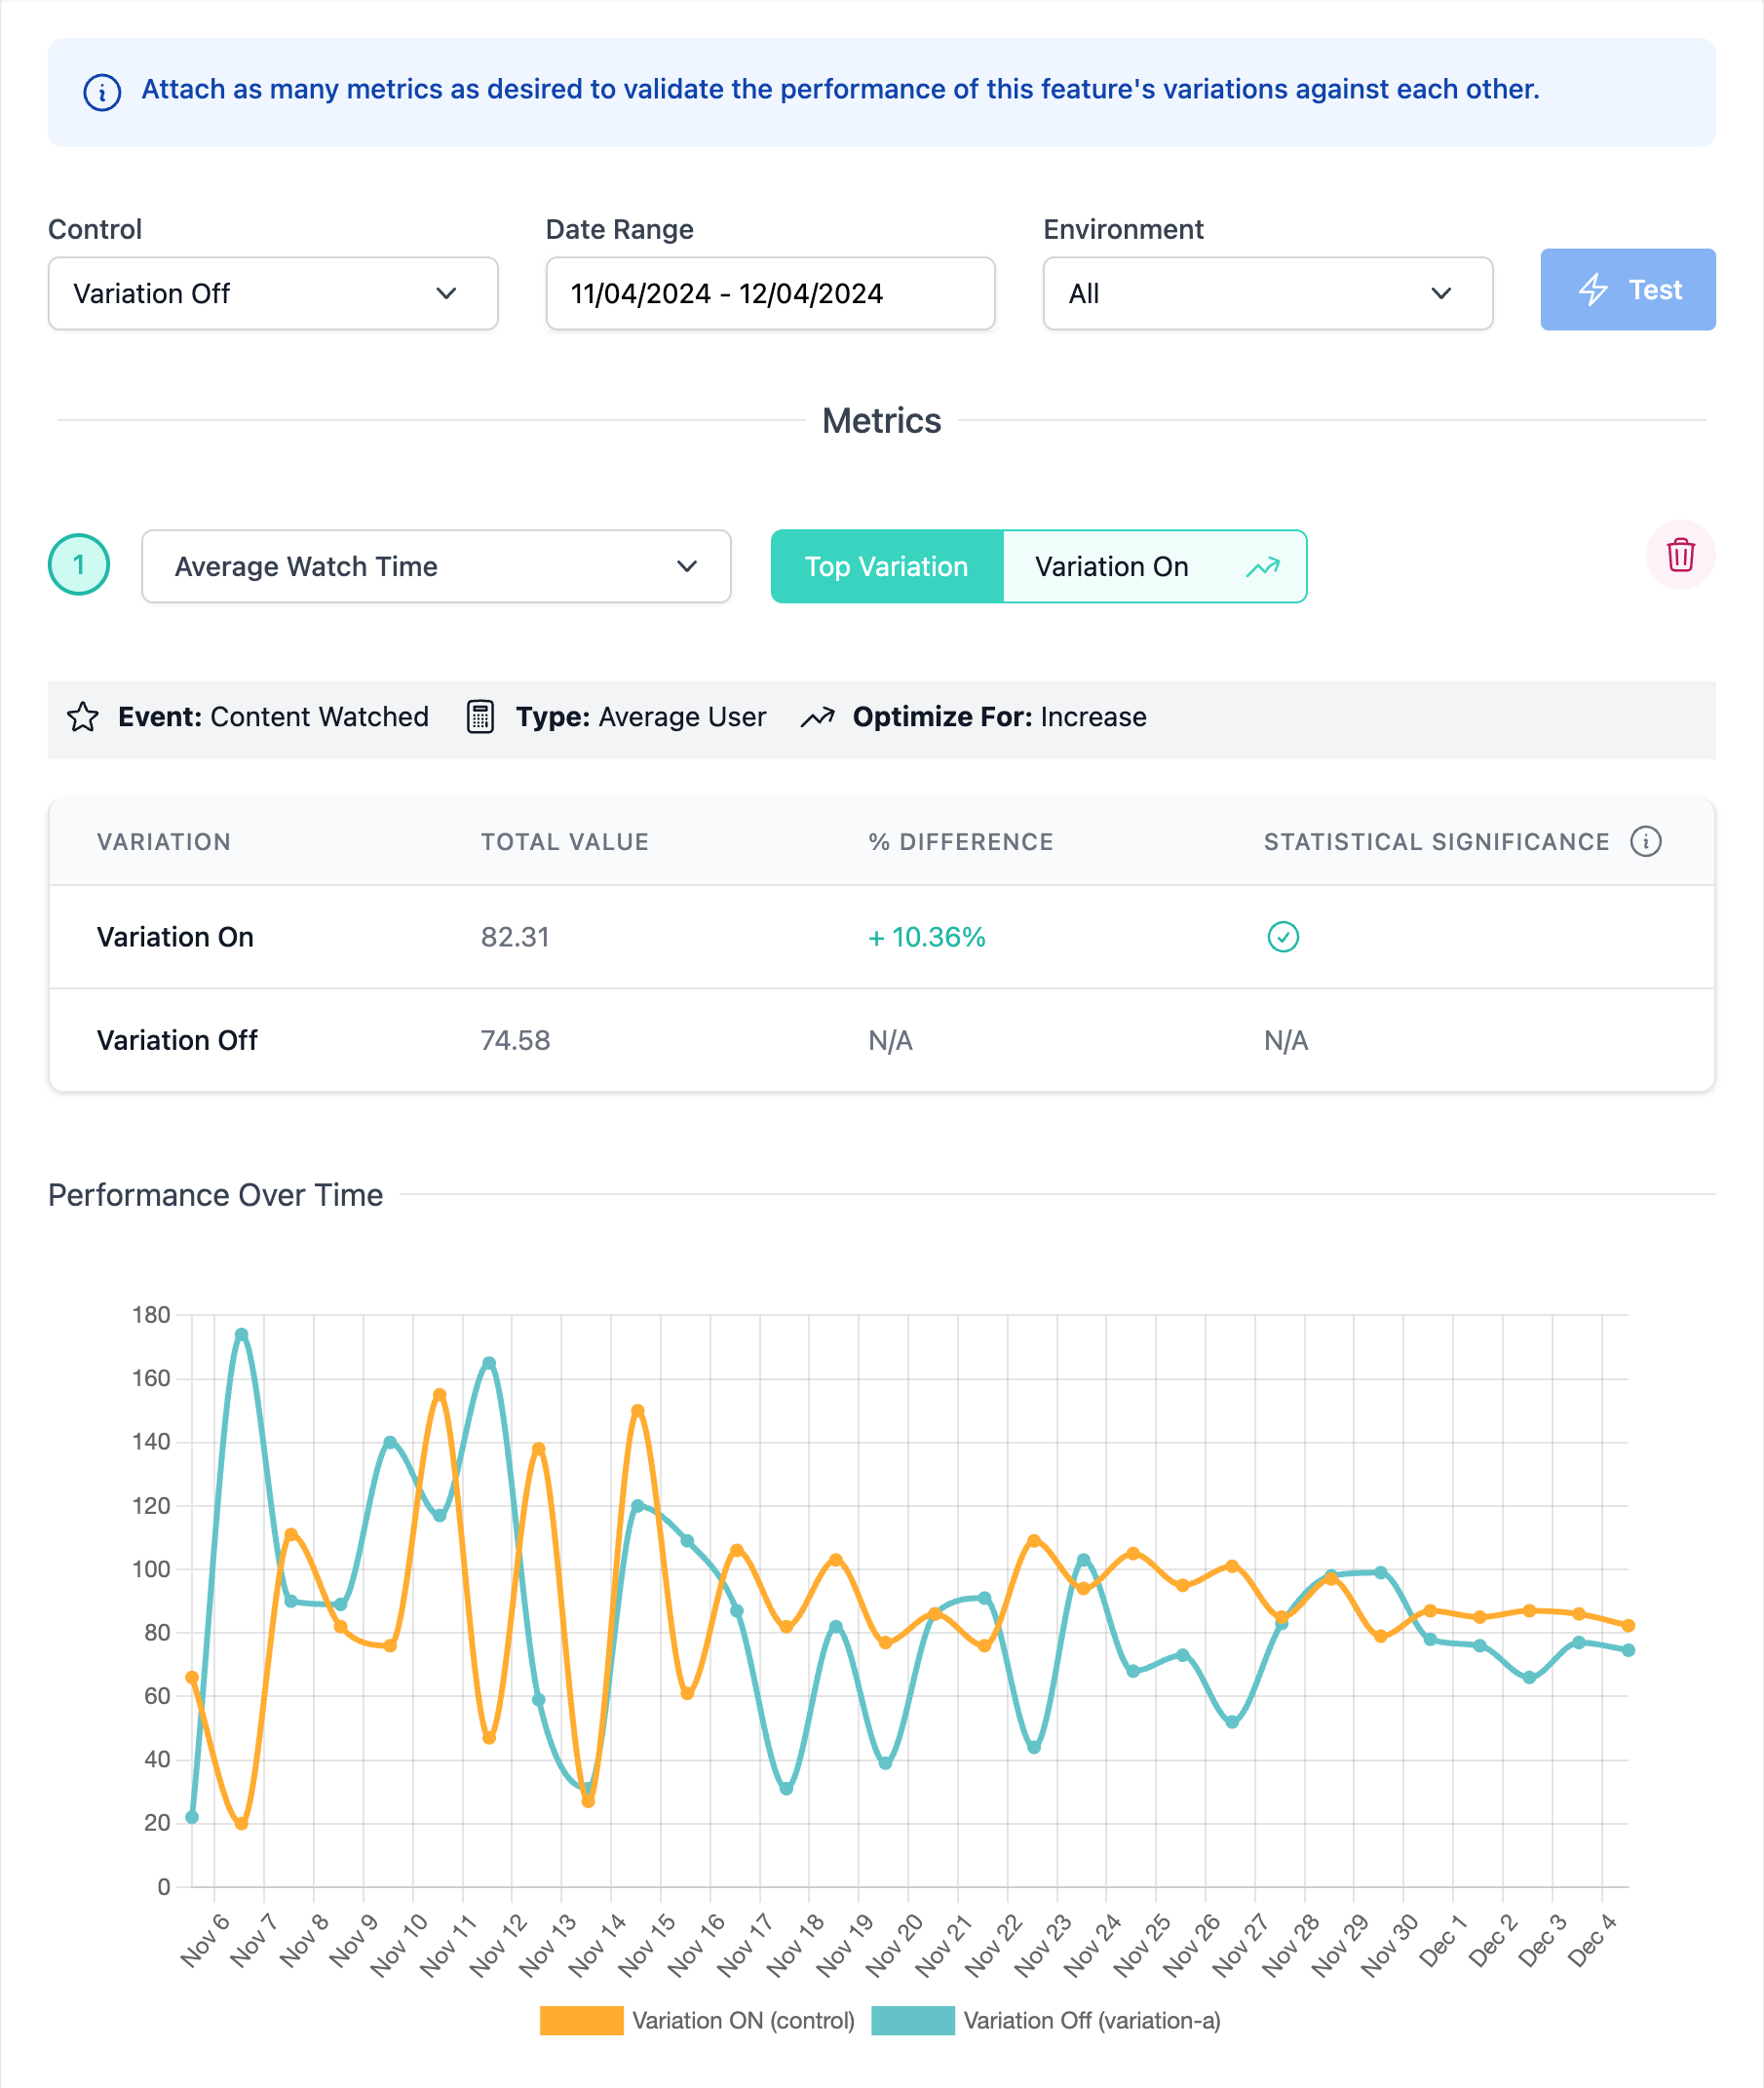
Once these fields are set, the test can be ran by clicking the test button, resulting in a test result.
(For these documents, our own internal Metrics testing at this time were used!)
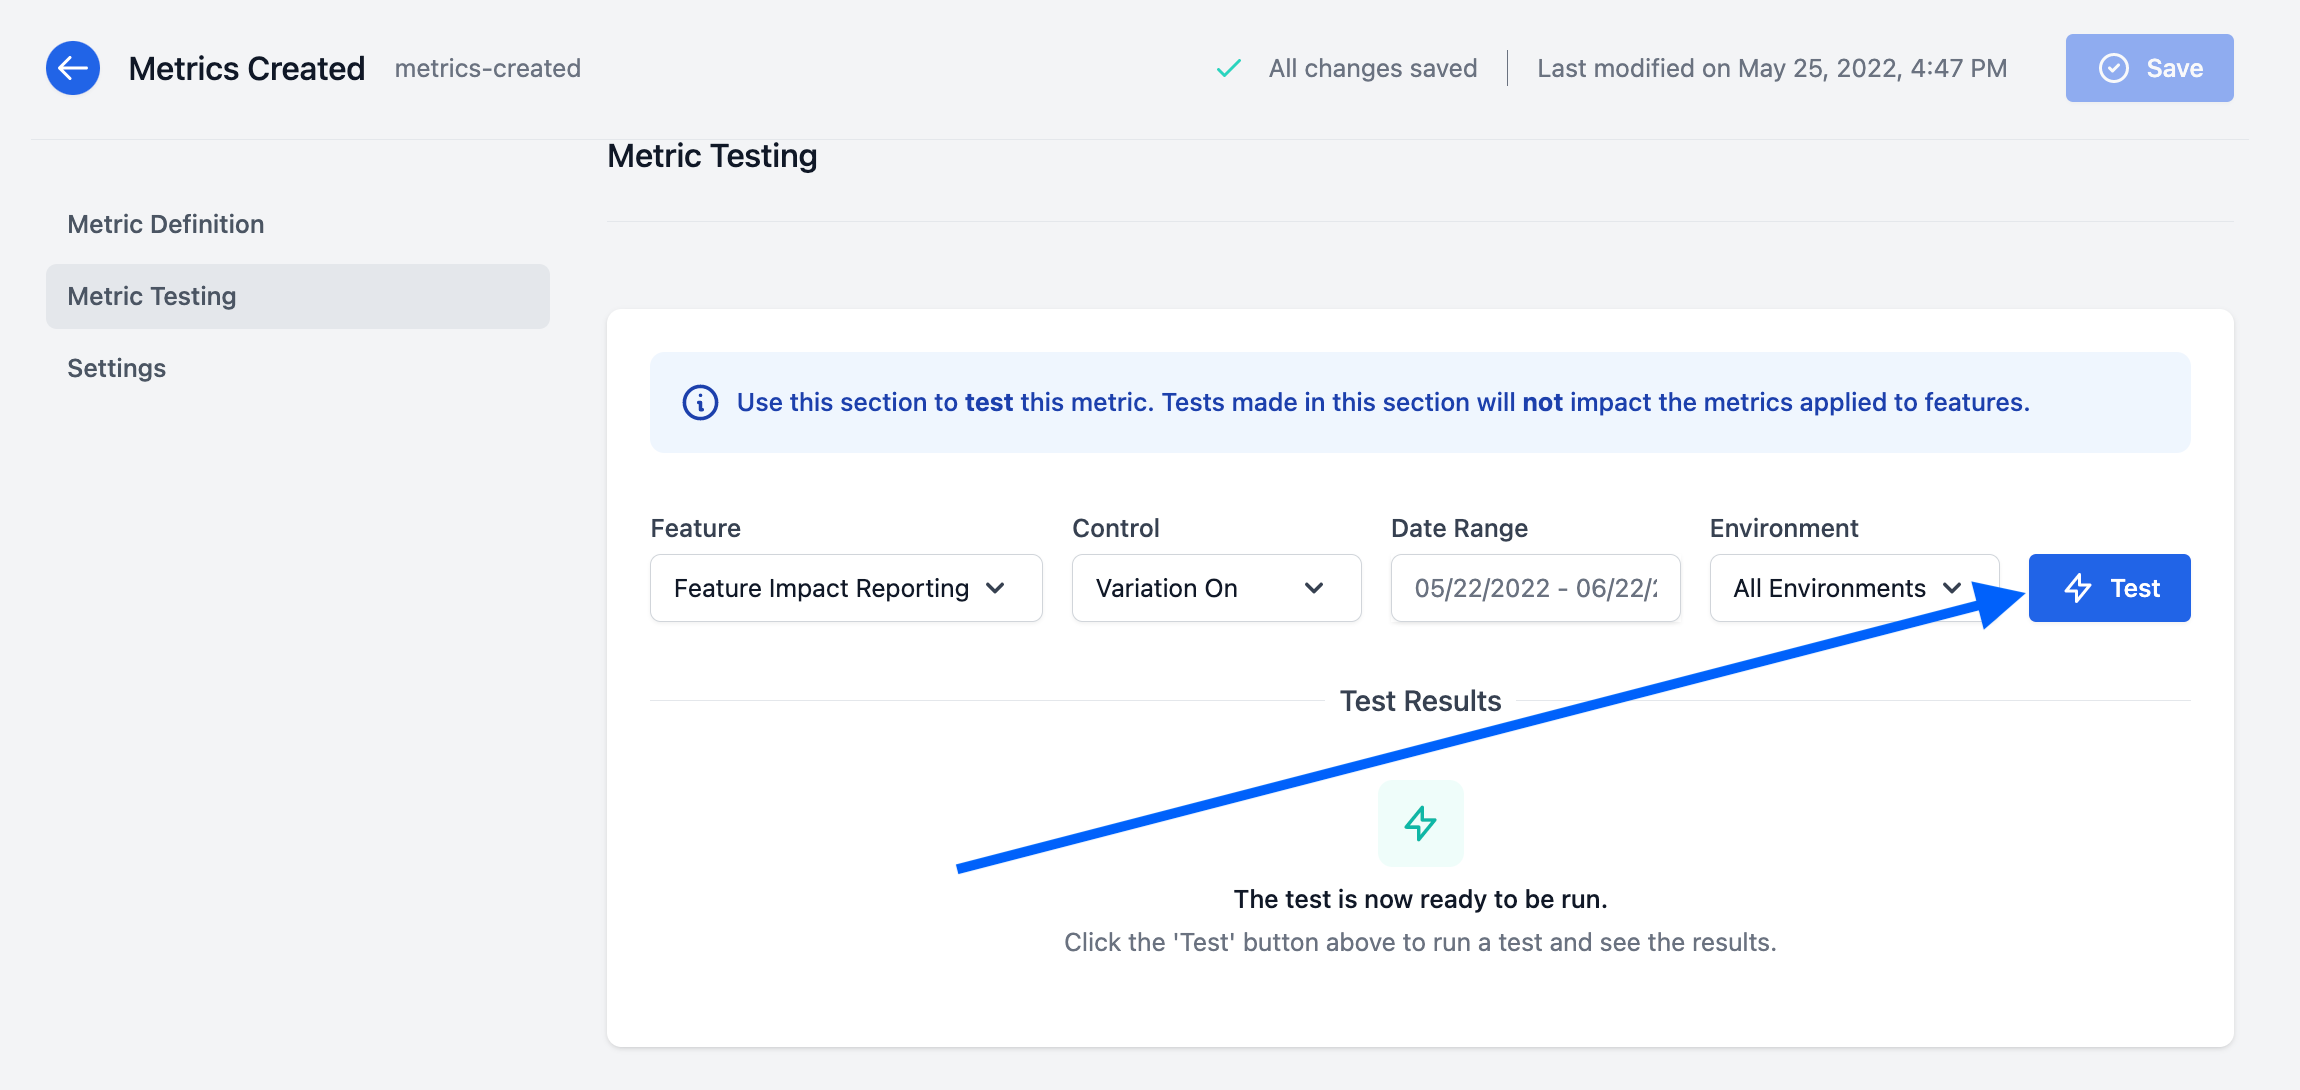
The results of this test will show the actual result which would be within a Feature if this Metric was associated with it!
Attaching Metrics to Features
Tracking Metrics within a Feature is an important aspect of data analysis, as it can provide valuable insights into the performance and behaviour of different Features. Once a Metric has been created, it can be attached to any Feature for use and analysis.
Follow the video below from our DevCycle Experiment Setup series or read-along to find out how to add a Metric to a Feature and view Experiment results.
Here are the steps you can follow to track Metrics within a Feature:
-
Select the Feature you want to track: Within that Feature, navigate to the
Data & Resultstab on the Feature Form of the page and click onExperiment Results. -
Choose the Metric(s) associated with the Feature: Create new Metrics or attach existing ones to the Feature by navigating to the
Choose a Metricdropdown.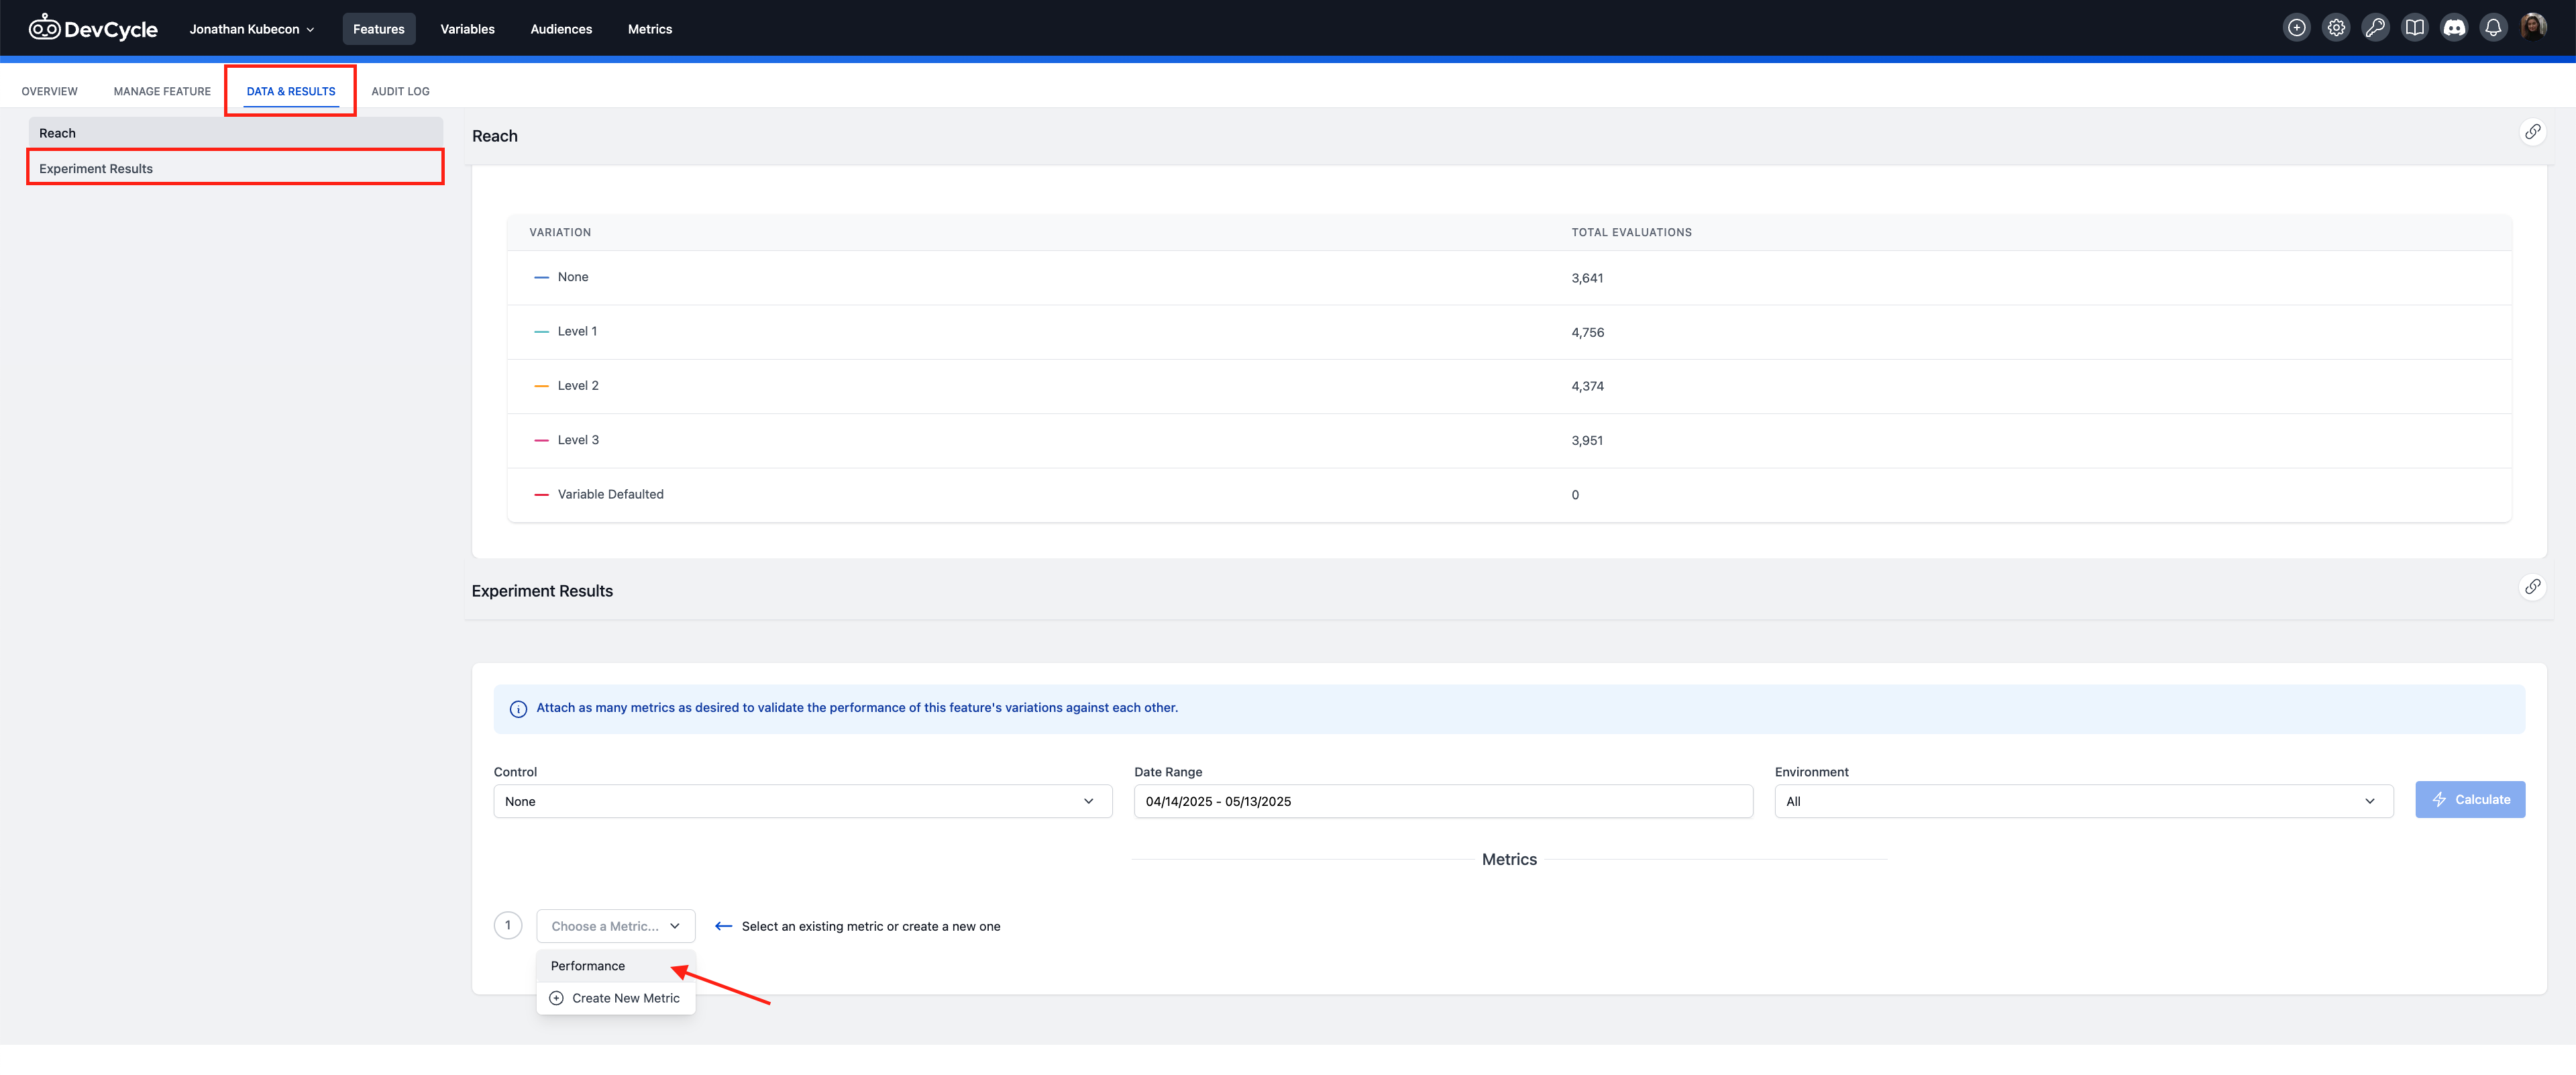
-
Attach the Metric(s): Attach the Metric from the dropdown menu by selecting it. For our example, let's use the Metric
Metric Testing, which has already been setup within our Project.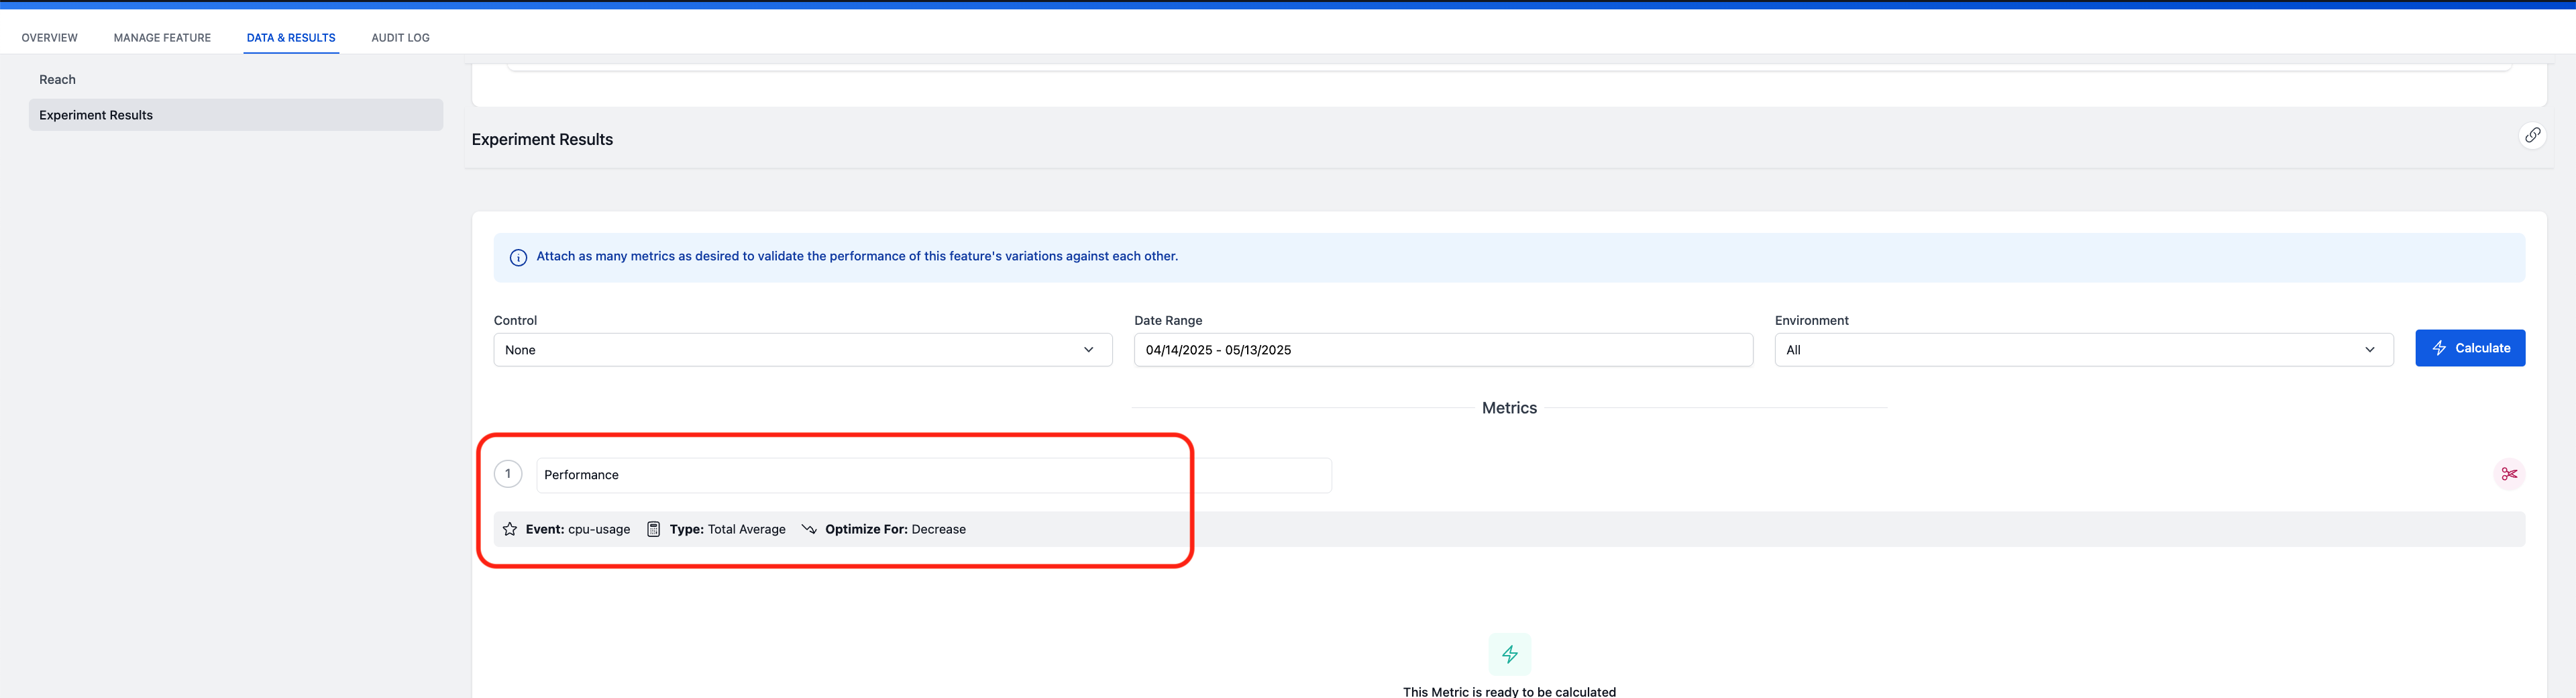
While the setup has some default values, the Metric requires the following fields to be filled:
-
Control - This is what will be used to show a comparative analysis against all other Variations in a Feature. Typically, an "off" or "Baseline" Variation would act as the control. For more information on this, please refer to the Feature Experimentation documentation.
-
Date Range - Select a date range of up to the last 30 days to display results for. This range will default to the last 30 days or to the Feature creation date if the Feature was created within 30 days.
-
Environment - This will calculate the Metric using events from the specified environments.
-
-
Calculate results: Once one or more Metrics have been selected, we can then run the Metric calculation to generate insight into how the Feature is doing.
-
View your results: Once calculated, if there is available data for the Feature, the results data will populate within the dashboard.
From here, useful information such as trends and patterns in the data can be used to make informed decisions about how to optimize the Feature for performance improvements.
How do Metrics get calculated?
To calculate Metrics, DevCycle uses the custom events sent via its API or SDKs. Each Event has the information of which user sent it and which Feature and Variation they were in at that time. For optimal Experiments, use Features with Variations randomly distributed across users.
To read more on the queries behind the Metrics, see How Metrics Are Calculated
Running Experiments
With Metrics on a Feature, Experimentation can be easily executed on any Feature. At DevCycle we believe that Experimentation should be a part of the natural lifecycle of all Features. So no matter the Feature type selected, Experimentation will always be available for use.
To learn more on how to run Experiments with DevCycle, read Feature Experimentation