Web Debugger
The Web Debugger is an embeddable tool for inspecting and testing DevCycle directly on your site. Authorized users can view active Feature configurations, apply Self-Targeting Overrides, and monitor SDK events in real time—without switching back to the dashboard.
Why use it?
-
Quickly test changes with Self-Targeting Overrides: Force a specific Variation or Variable values for your current DevCycle Identity and see the effect immediately on the page.
-
Inspect live configuration: View which Features, Variations, and Variables you’re currently being served; expand rows to see exact Variable values.
-
Reproduce issues tied to user identity: Modify User ID, Email, or custom properties in the Debugger. This triggers the SDK’s
identify()function and fetches a fresh configuration, making it easy to replicate conditions for a specific user. -
Monitor SDK activity: Watch configuration fetches, flag evaluations, and your app’s custom events in real time to validate logging and data flow.
The Web Debugger does not change project-level targeting rules or audiences. It only affects the current session via Self-Targeting Overrides and identity updates.
The Web Debugger is currently in beta. If you have any feedback or suggestions, please let us know by email.
Installation
The Web Debugger is available as a standalone NPM package that can be installed in your frontend projects. Install the package from NPM
npm install @devcycle/web-debugger
yarn add @devcycle/web-debugger
Getting Started
To use the Web Debugger, you need to initialize it somewhere on the page and provide the instance of the DevCycle SDK you are using on the current page. The Web Debugger will automatically connect to the SDK and start listening for events.
For regular Javascript usage:
import { initializeDevCycleDebugger } from '@devcycle/web-debugger'
import { initializeDevCycle } from '@devcycle/js-client-sdk'

const client = initializeDevCycle('SDK_KEY', { user_id: 'my-user' })

initializeDevCycleDebugger(client)
This will initialize the Debugger using the default options.
React
If you are using React, you can alternatively initialize the Debugger using the included React component:
import { DevCycleDebugger } from '@devcycle/web-debugger/react'

// render the component anywhere within the DevCycle React SDK's Provider context
export default function SomeComponent({ children }) {
  return (
    <>
      <DevCycleDebugger />
      {children}
    </>
  )
}
The React component makes setup slightly simpler because it automatically obtains the SDK client from the React SDK's provider context. Any options that the regular Javascript function accepts can be passed as props to this component.
Next.js
If you are using Next.js, you can alternatively initialize the Debugger using the included React component:
import { DevCycleDebugger } from '@devcycle/web-debugger/next'

// render the component anywhere within the DevCycle Next SDK's Provider context
export default function SomeComponent({ children }) {
  return (
    <>
      <DevCycleDebugger />
      {children}
    </>
  )
}
The React component makes setup slightly simpler because it automatically obtains the SDK client from the Next SDK's provider context. Any options that the regular Javascript function accepts can be passed as props to this component.
Controlling Visibility
By default, the Debugger will show any time the environment variable NODE_ENV is set to 'development'.
To control when the Debugger is visible (and for who), there are two options available.
Using a DevCycle Variable
The recommended approach is to tell the Debugger to only show itself when a specified DevCycle Variable is enabled for the current user. To do so, pass the shouldEnableVariable option:
initializeDevCycleDebugger(client, {
  shouldEnableVariable: 'debugger-enabled',
})
This allows you to use DevCycle's Targeting Rules to control who can see the Debugger. For example, you can make sure it only shows for internal users, or users with a special Custom Property set.
Using a Boolean or Custom Function
If you want direct control over the Debugger's visibility, you can also pass the option shouldEnable. You can provide either a boolean or a function that returns a boolean. If the boolean or the result of running the function is "true", the Debugger will show.
initializeDevCycleDebugger(client, {
  shouldEnable: process.env.SHOULD_SHOW_DEBUGGER,
})

initializeDevCycleDebugger(client, {
  shouldEnable: () => process.env.SHOULD_SHOW_DEBUGGER,
})
Keep in mind that if both shouldEnable and shouldEnableVariable are passed, shouldEnable will take precedence.
Positioning
The Debugger will position itself in the bottom right corner of the screen by default. You can also move it to the bottom left by passing the position option set to left.
Usage
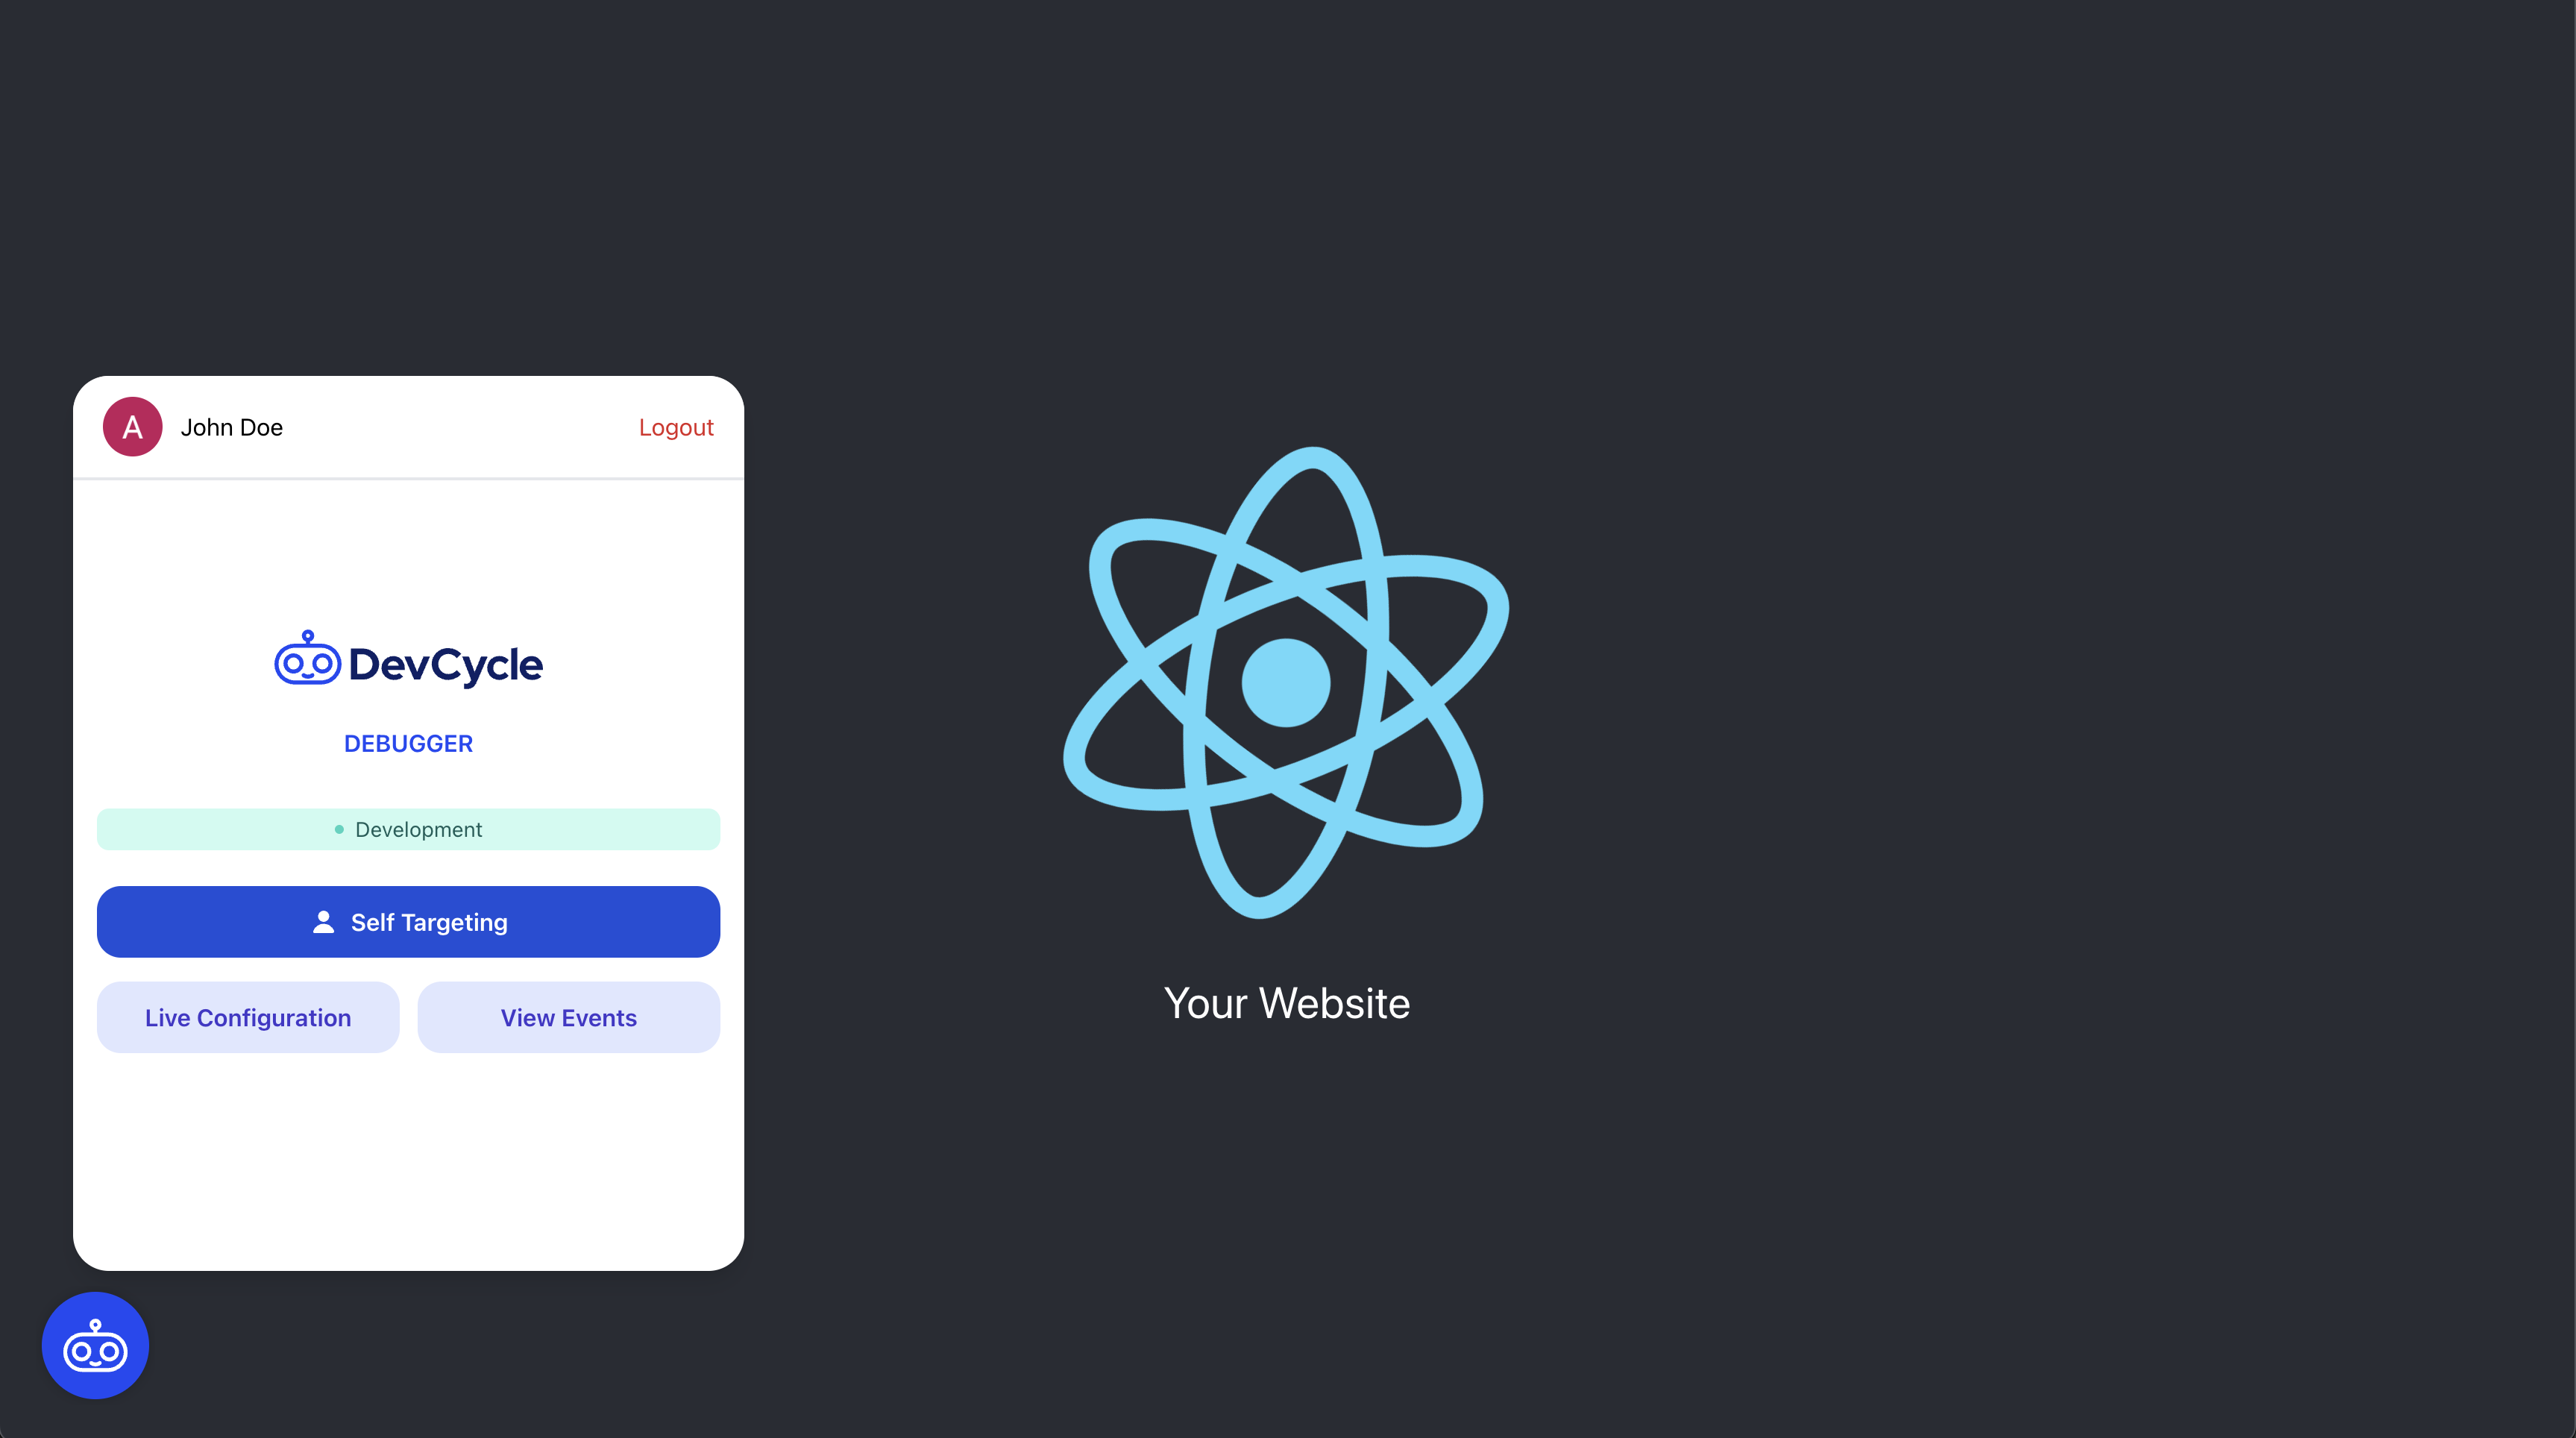
Once initialized, the Web Debugger adds a toggle button to your site's corner.
Clicking this button opens the Debugger. You'll first see a login screen, where you sign in with your DevCycle dashboard credentials. Access is limited to users with a DevCycle account.
The Debugger provides three main areas of functionality:
Self-Targeting
The Debugger allows you to quickly change your Self-Targeting Overrides and see the changes reflected immediately on the current page. If you don't currently have Self-Targeting set up, the Debugger will present an option to quickly set your "DevCycle Identity" to the currently identified user on the page.
Once set, you can now view and modify your Overrides for any Feature in your project.
Below is an example of us using the Web Debugger for our own DevCycle instance:
Live Configuration & User Identity
In the "Live Configuration" section, you'll find a list of the Features and Variations that you are currently being served by DevCycle on this page. Each row can be clicked to expand and see the set of Variables and their values which are associated with that Feature and Variation.
At the top of this section you can also see the current user data that you've been identified with on this page, and modify User ID or Email and/or any custom property. Applying changes to that data will trigger the SDK's identify function and trigger a new configuration to be retrieved from DevCycle.
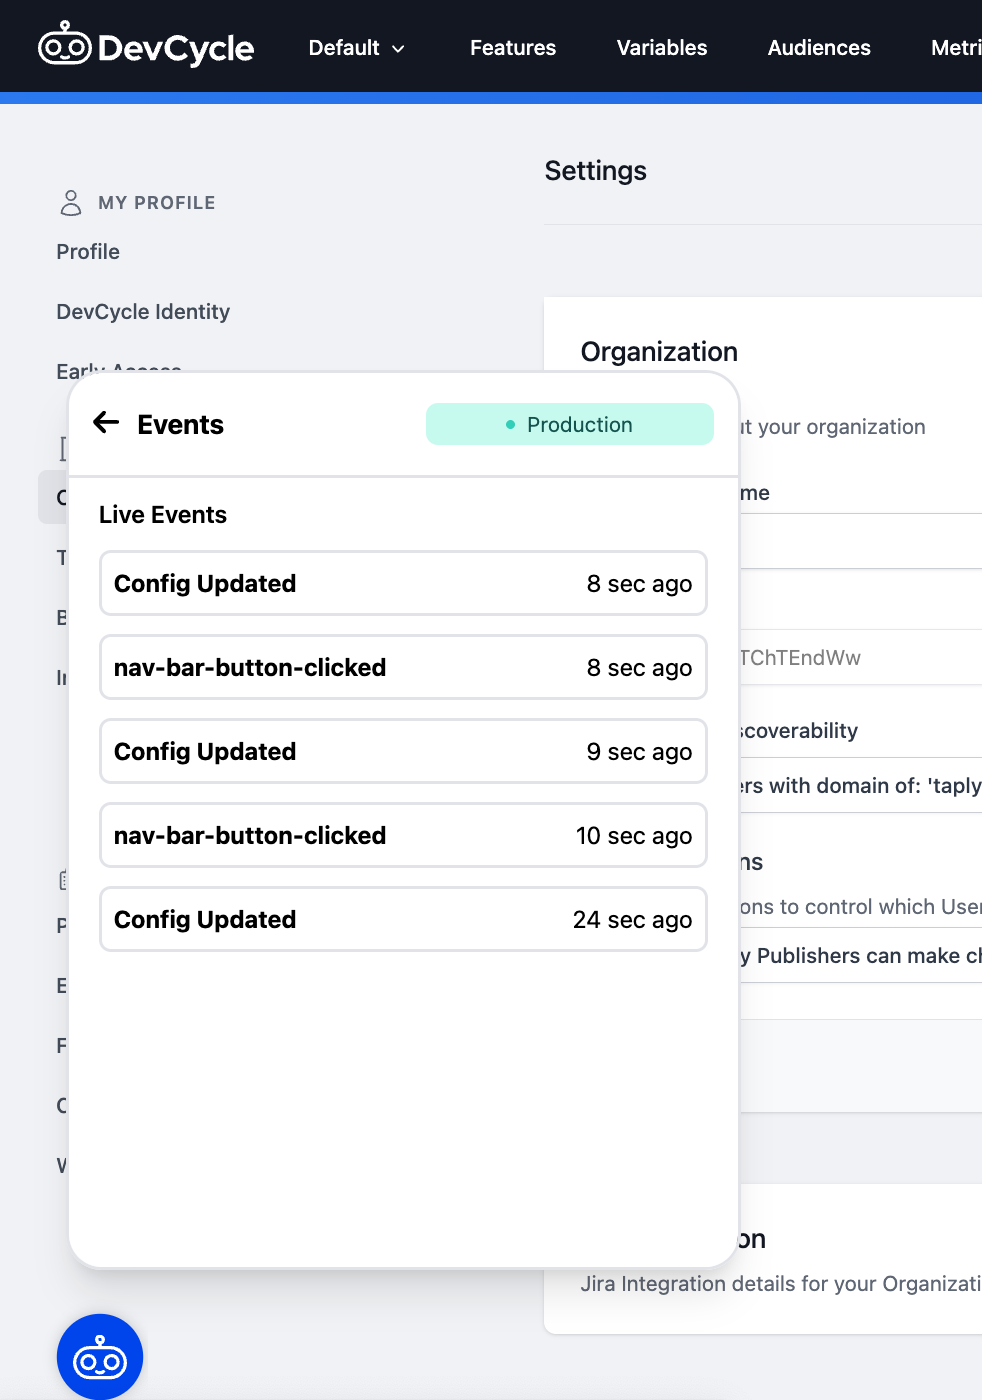
Events
The Events section shows a real-time stream of events from the SDK, including new configs being obtained and any custom events that you are tracking yourself.